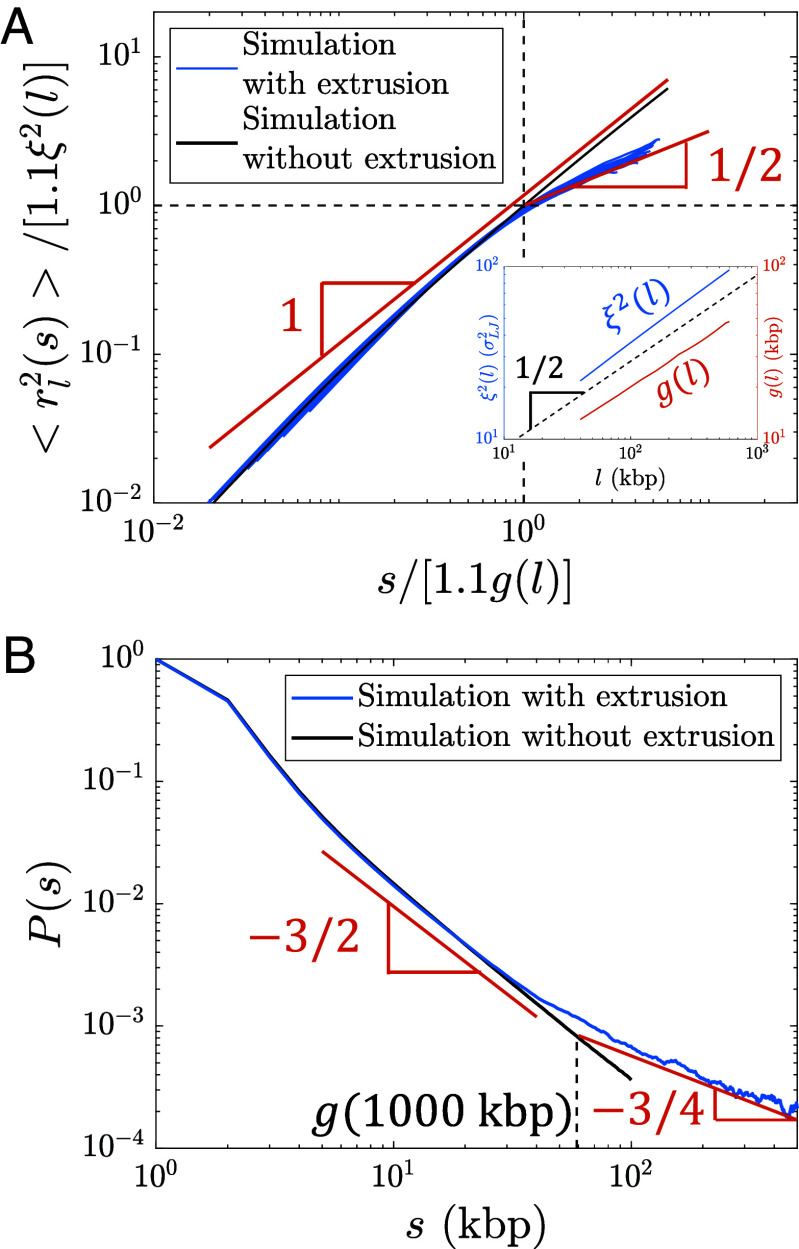
Fig. 6.
Internal structure of actively extruded loops from hybrid MD—MC simulations with kbp per () starting from a relaxed polymer chain with unperturbed fractal dimension . (A) Mean square distance between two loci extruded by the same cohesin domain separated by genomic distance within a loop of genomic length (Eq. 8). Each blue curve corresponds to a different loop length l = 40, 80, 120, …, 600 kbp. The red lines show the predicted scaling behavior. The abscissa and ordinate are scaled by and , respectively. and were obtained from a simulation of relaxed chromatin without extrusion (see Inset and SI Appendix for details). The factor of 1.1 shifts the crossover between scaling behaviors to and (dashed black lines). (B) Average contact probability between loci separated by genomic length s within an extruded loop, averaged over loop lengths kbp. The dashed vertical line indicates the crossover to , which is approximately . The red lines show the predicted scaling behavior.

