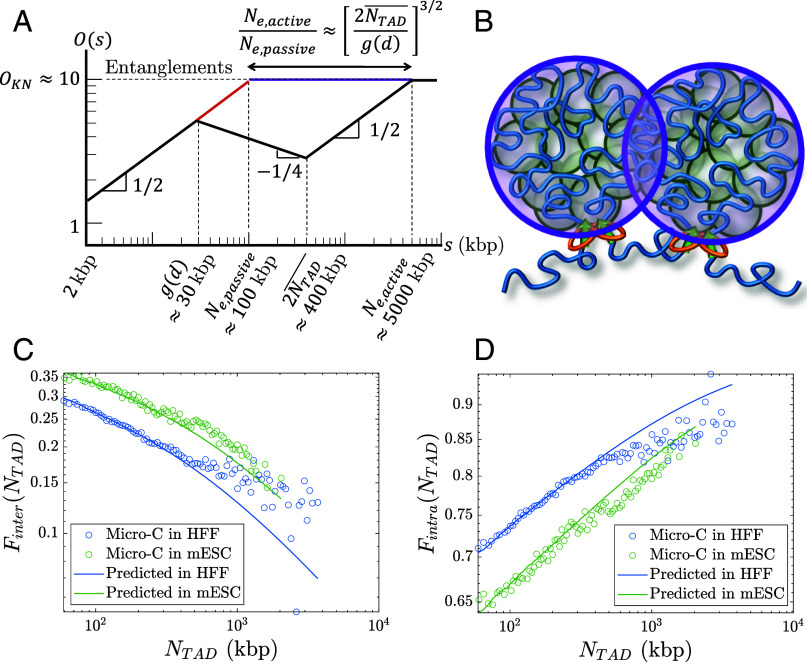
Fig. 9.
Overlaps between chromatin sections. (A) Schematic plot of the overlap parameter for active loop extrusion (black), random walks (red), and FLGs (purple) as a function of genomic length on a log–log scale. The black and purple curves merge for . The horizontal dashed line indicates the onset of entanglements. We use the volume fraction of chromatin in the nucleus and . (B) Chromatin sections within TADs (green circles) overlap and have increased contact probabilities. Neighboring TADs (purple circles) are mostly segregated apart from a narrow interface. (C) Inter-TAD fraction of all intrachromosomal contacts made by loci in a TAD as a function of TAD length. (D) Intra-TAD fraction of all intrachromosomal contacts made by loci in a TAD as a function of TAD length.

