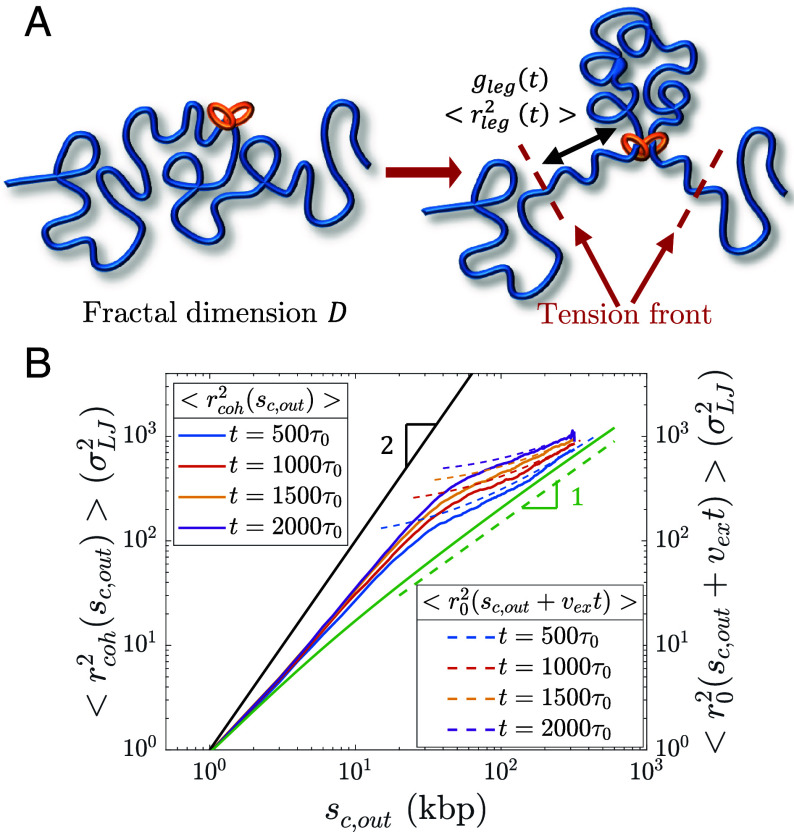
Fig. 10.
Conformation of legs produced by active loop extrusion. (A) Schematic of legs, each with genomic length and mean square size . The left-hand schematic shows the initial chromatin conformation with fractal dimension at the time of cohesin binding. The right-hand schematic shows leg extension at time t. (B) Mean square distance between cohesin and a locus away outside of its extruded loop at different times after binding (solid lines) compared to , the unperturbed mean squared sizes of sections with genomic lengths (dashed lines), from hybrid MD—MC simulations of single cohesins actively extruding a relaxed polymer chain () with kbp per (). The solid black line is the predicted limiting behavior for full polymer extension. The solid green curve is the unperturbed mean square sizes of sections with genomic length . The dashed green line is the predicted scaling behavior of these unperturbed sizes without extrusion.

