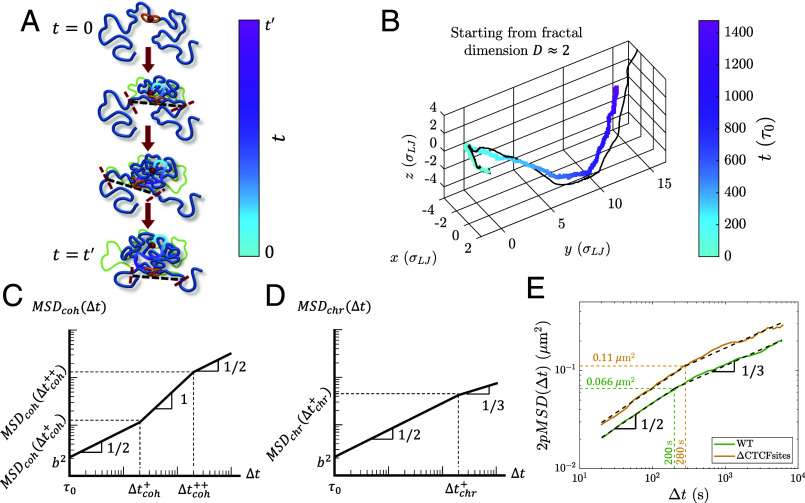
Fig. 11.
Dynamics of cohesin and chromatin loci during active extrusion. (A) Cohesin trajectory (gradient curve) after binding to chromatin at its binding site (red circle) at time . The thick blue curve represents chromatin at a given moment, and the thin green curve represents the initial conformation. The gradient from cyan to magenta indicates time. Dashed black lines connect the tension fronts (indicated by dashed red lines) at different times, which propagate through the section with time. (B) Average cohesin trajectory (gradient curve) from a fixed binding site and the corresponding smoothed trajectory of midpoints between two tension fronts (black curve) from 200 simulations starting from the same initial conformations with kbp per () starting from . (C) MSD of actively extruding, chromatin-bound cohesins on a log–log scale. (D) MSD of chromatin loci affected by active extrusion on a log–log scale. (E) 2pMSD between CTCF sites separated by 515 kbp in wild-type mESC (solid green curve) and cells with the CTCF binding motifs deleted (CTCFsites, solid yellow curve) (54) fitted to the two power laws and (dashed black lines) predicted for genomic locus dynamics (see SI Appendix for fitting details). 2pMSD data were extracted using a plot digitizer (61). The dashed green and yellow lines indicate the intersection of the fitted power laws for wild-type and CTCFsites cells, respectively.

