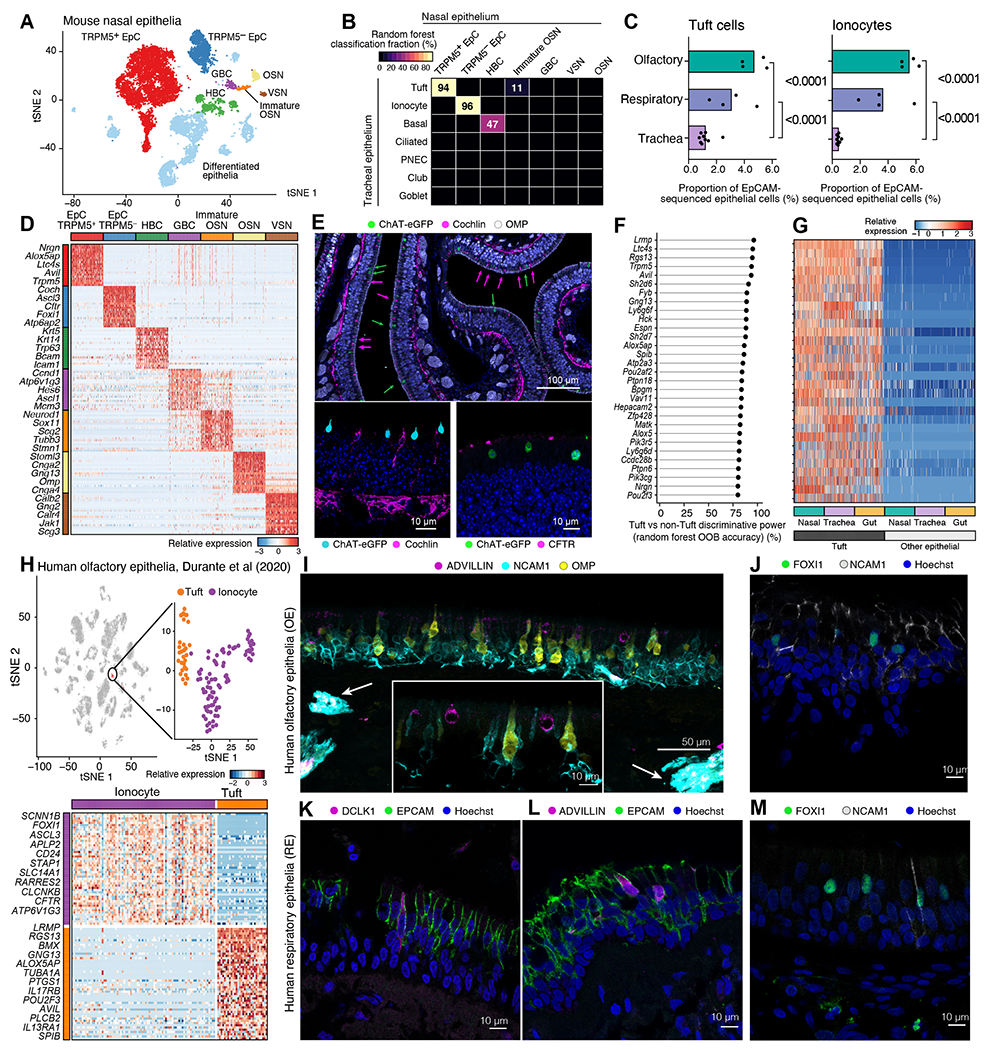
Figure 1. Tuft cells and ionocytes comprise the two MVC types of the olfactory epithelium in mice and humans.

(A-G) The nasal respiratory and olfactory epithelium of ChAT-eGFP mice was assessed after enrichment for ChAT-eGFP cells (as in S1A). (A) tSNE embedding of 13,052 cells (n=4 mice from two independent experiments), colored and labeled by unsupervised clustering. (B) Heatmap shows the fraction of cells (color bar) of each nasal epithelial cell type (columns, types as in A) classified as each tracheal cell type (rows) using a random forest. (C) Fraction (x-axis) of tuft cells (top) and ionocytes (bottom) in all epithelial cells from each mouse (points), in each tissue, from EpCAM+ cells in naïve nasal mucosa (dataset introduced in Fig. 3, p-values: Wald test). (D) Relative expression (row-wise z-score of log2(TPM+1)), (color bar) of top 50 genes (rows) specific to each cell type (FDR<0.05) in our dataset; two selected genes are shown. (E) Cross-section of olfactory epithelium of ChAT-eGFP mice stained for ChAT-eGFP (tuft cells), cochlin and CFTR (ionocytes), OMP (OSNs, top image). Hoechst (blue) is used to mark nuclei in all images. Green arrows point at tuft cells, magenta arrows point at ionocytes in the top image. (F) Top 30 pan-tissue tuft cell marker genes (y-axis) ranked by out of bag (OOB) accuracy (x-axis) from random forest classification. (G) Relative expression of top tuft cell marker genes (ordered as in F) in tuft and other epithelial cells across three tissues. (H-M) Single-cell sequencing (H) and histology (I-M) of human nasal mucosa. (H) tSNE embeddings (top) of 3,528 olfactory epithelial, immune and neuronal cells (40) showing new re-analysis of a cluster of 116 MVCs containing tuft cells and ionocytes (inset), and heatmap (bottom) of differentially expressed genes (FDR<0.05, rows) between the MVC subtypes (40). Selected marker genes are shown. (I-M) Immunofluorescence of olfactory (I, J) or respiratory epithelium (K-M) from superior turbinates of controls without sinus disease (I, J, M) or of patients with CRS (n=3) (K, L). Arrows in I indicate olfactory axon bundles in the submucosa.
