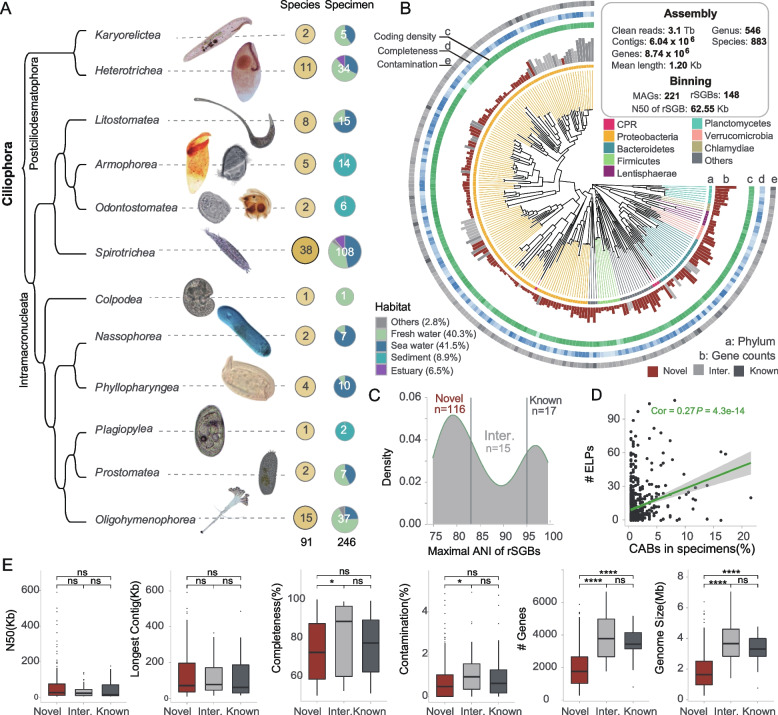
Fig. 1.
Identification of ciliate-associated bacteria from samples covering almost the entire phylum Ciliophora. A Specimens covers almost the entire Ciliophora phylum. B Approximately maximum-likelihood phylogenetic tree of the 148 rSGBs in ciliates. The circular regions labeled from a to e in the plot represent the taxonomy of phylum, gene number, density of coding genes, completeness, and contamination, respectively. C Distribution of the maximum ANI distance of rSGBs compared to the reference database. D Spearman correlation analysis between the number of ELPs in CABs and their frequency in specimens. E A comparison of the genome size, N50, longest contig, completeness, contamination, gene content and genome size among different types of rSGBs. All P values in this figure were calculated based on two-tailed Wilcoxon test

