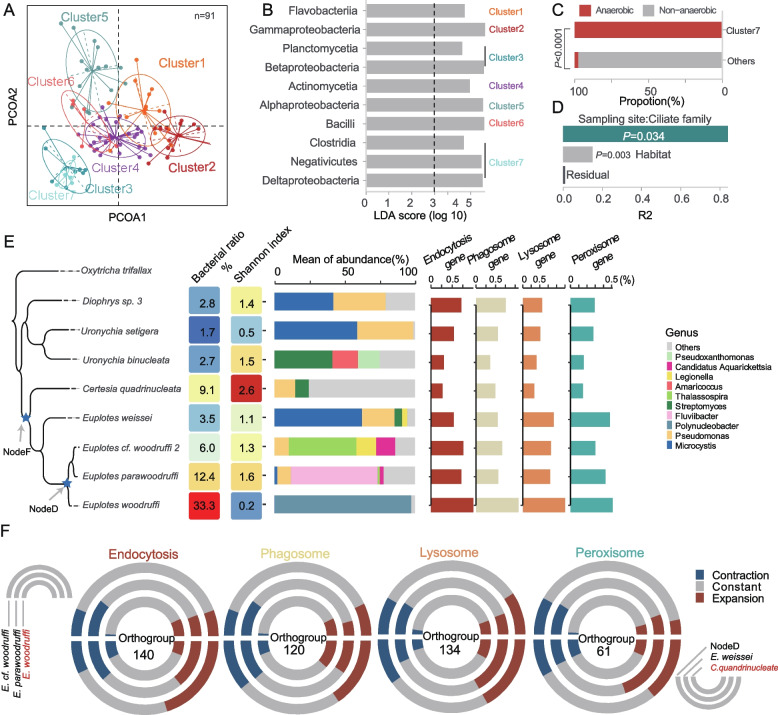
Fig. 3.
Influence of host, environment, and genomic amplification methods on microbial community. A Visualization of the PCoA and clustering analysis of class-level symbiotic communities among 91 ciliate species. B The signature bacterial class of CABs cluster. LDA score determined using linear discriminant analysis effect size (LEfSe) analysis. C The barplot illustrates the significant enrichment of Cluster 7 in anaerobic ciliates. D Distribution of R2 values for different factors in the analysis of the CABs community of 91 ciliates using the Permanova test. Each bar represents the R2 values for a specific factor, indicating the extent to which the factor explains the variation in the composition of CABs. E The influence of the host on CABs. From left to right: phylogenetic tree of Euplotes, total bacterial content, Shannon index, symbiont relative abundance at the genus level, and content of functional genes. F Gene family expansion and contraction events. The upper diagram illustrates the events observed in E. cf. woodruffi, E. parawoodruffi and E. woodruffi, while the lower diagram represents the events that occurred in C. quadrinucleata, nodeD, and E. weissei. The number within each circle denotes the count of orthologous groups

