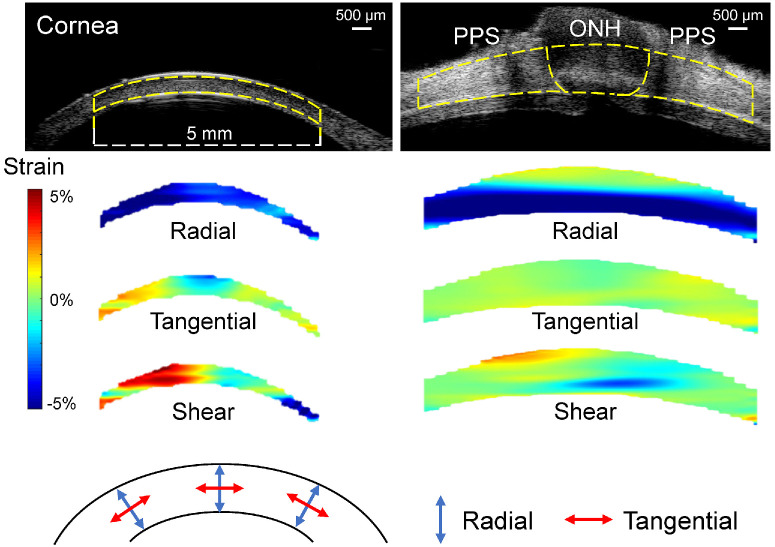
Figure 4.
Representative maps of radial, tangential, and shear strains in a cornea and a posterior eye of the same donor at 30 mmHg. As the color bar indicates, cyan to blue is negative strain (e.g. compression for radial strain), whereas yellow to red is positive strain (e.g. tensile tangential strain). Dashed yellow lines in the ultrasound images delineate the region of interest for strain analysis.

