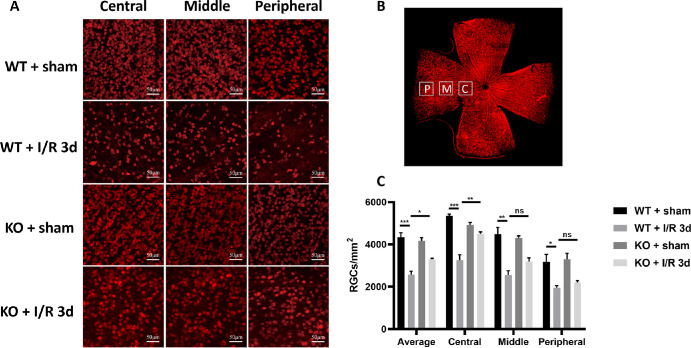
Figure 4.
Effect of CD38 KO on the number of RGCs in mice in the I/R model. (A) Immunofluorescence staining of Rbpms in retinal flat preparations from sham WT and KO mice and I/R 3d WT and KO mice (representative images showing the central, middle, and peripheral ganglion cells in the retina). (B) Schematic drawing of retinal flat and counting. (C) Quantitative analysis of mean RGCs in the central, middle, peripheral, and whole retina. P = the peripheral, about 150 to 200 µm from the retinal margin. M = the middle, about 700 to 800 µm from the margin. C = the central, about 1500 to 1600 µm from the margin. Scale bars = 50 µm; WT, wild type; KO, knockout; data presented as: mean ± SEM; *P < 0.05, **P < 0.01, ***P < 0.001, n = 4.

