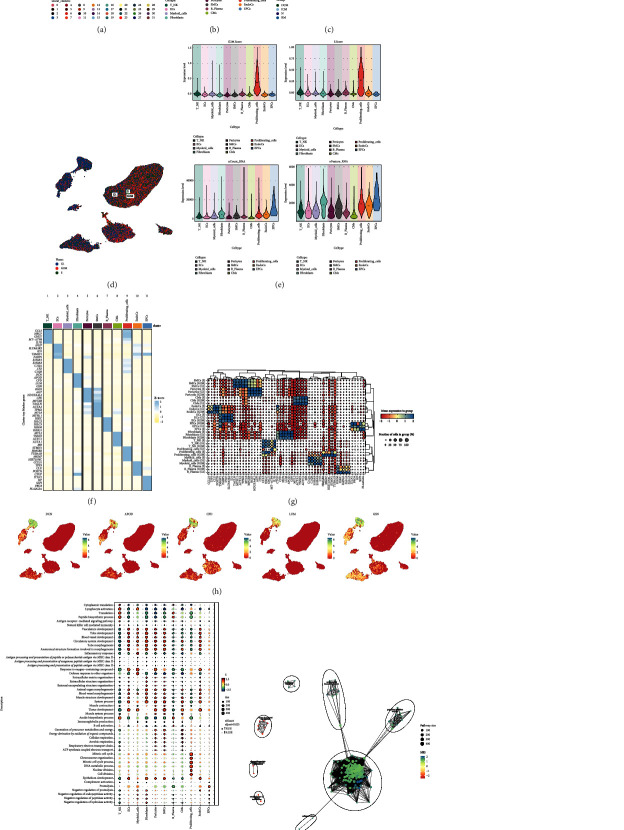
Figure 1.
Cell type identification and enrichment analysis of cardiomyopathy. (a) 179927 high-quality cells were categorized into 32 clusters and the distribution of the 32 clusters was demonstrated using UMAP plots. (b) UMAP plot showed the distribution of 11 cell types. (c) UMAP plot demonstrated the distribution of 4 groups in 11 cell types. (d) UMAP plot demonstrated the distribution of different cell cycles in 11 cell types. (e) Violin plot demonstrated G2M. Score, S.Score, nCount RNA, nFeature RNA in 11 cell types. (f) Heatmap showed the differential expression of Top5 maker genes for 11 cell types. (g) Bubble plot demonstrated the differential expression of maker genes for each of the 11 cell types when they are in different cell cycles. (h) UMAP plot demonstrated the differential expression distribution of Top5 maker genes in cardiomyopathy fibroblasts. (i) Bubble plot demonstrated the GO_BP enrichment results of 11 cell types. (j) Enrichment network graph demonstrated the enrichment of all differential genes among subpopulations of cardiomyopathy fibroblasts.

