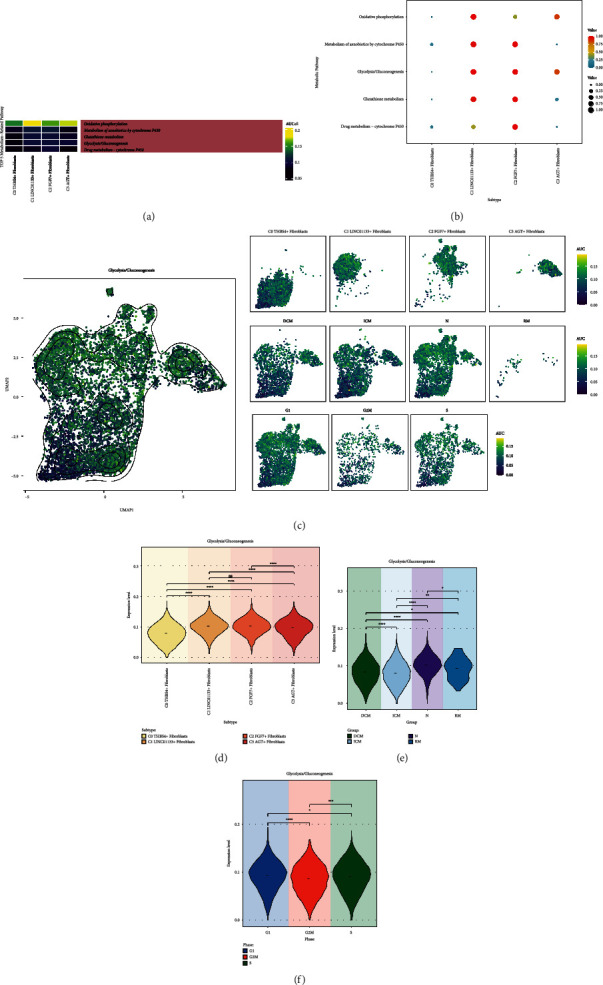
Figure 4.

Glycolysis/glycolysis metabolic pathway. (a) Heatmap demonstrated the AUCell scores of Top5 metabolism-related pathways for four fibroblast subpopulations. (b) Bubble plot demonstrated the expression of the 5 metabolism pathways in the 4 fibroblast subpopulations. (c) UMAP plots and faceted plots demonstrated the distribution of high and low AUCell scores of glycolysis/gluconeogenesis in 4 fibroblast subpopulations, 4 groups and different cell cycles. (d) Violin plot showed the difference in expression levels of glycolysis/gluconeogenesis in 4 fibroblast subpopulations. (e) Violin plot showed the difference in expression levels of glycolysis/gluconeogenesis in 4 groups. (f) Violin plots demonstrated the expression level differences of glycolysis/gluconeogenesis in different cell cycles. ∗p < 0.05, ∗∗p < 0.01, ∗∗∗p < 0.001, ∗∗∗∗p < 0.0001, ns indicates no statistical difference.
