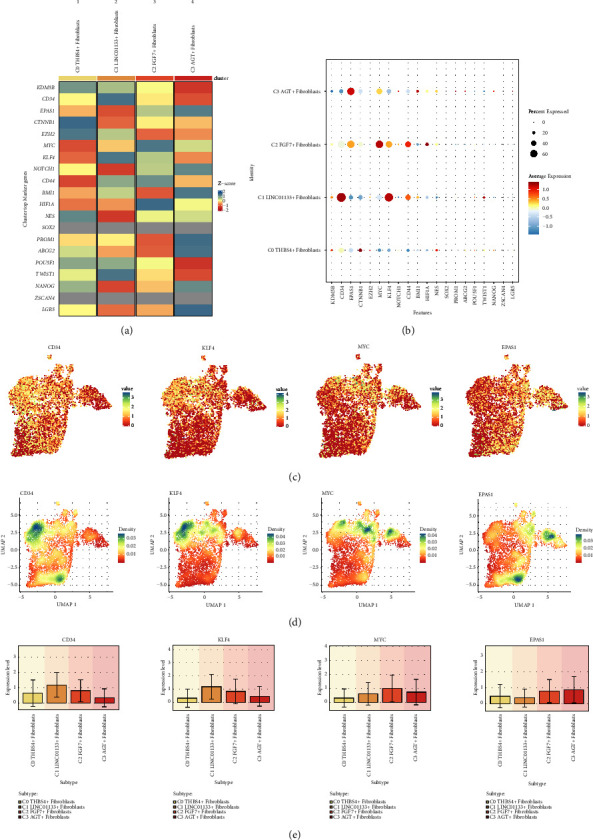
Figure 5.

Visualization of stemness genes in cardiomyopathy fibroblast subpopulations. (a) Heatmap demonstrated the Z-score of differential stemness genes of the four fibroblast subpopulations. (b) Bubble plot demonstrated the average expression levels of differential stemness genes of the 4 fibroblast subpopulations. (c) UMAP plot demonstrated the distribution of the expression of the 4 stemness genes CD34, KLF4, MYC, EPAS1. (d) UMAP plot demonstrated the distribution of the densities of the 4 stemness genes CD34, KLF4, MYC, EPAS1. (e) Bar graph demonstrated the comparative expression levels of 4 stemness genes CD34, KLF4, MYC, EPAS1 in 4 fibroblast subpopulations.
