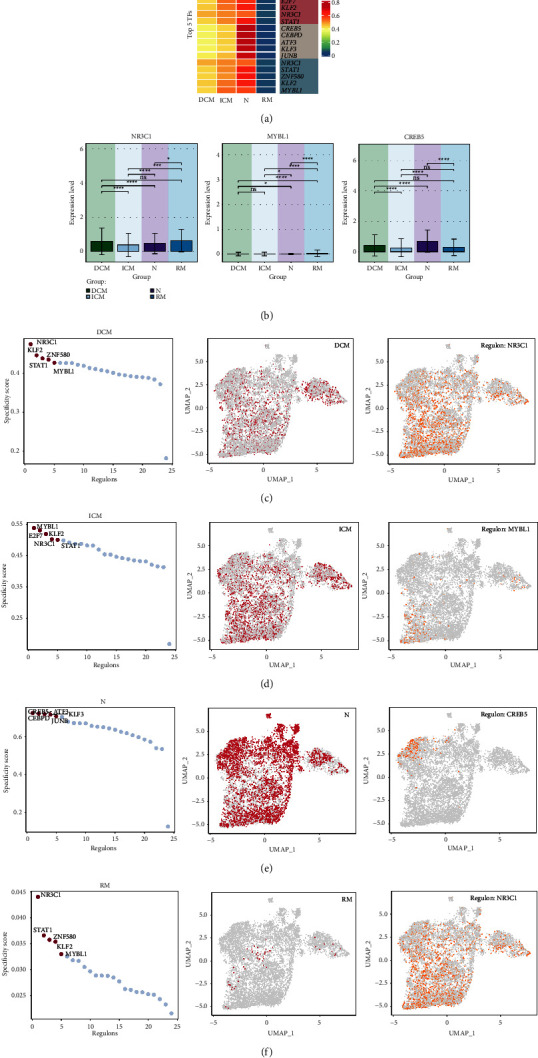
Figure 8.

Cardiomyopathy groups gene regulatory network analysis. (a) Heatmap demonstrated the expression levels of Top5 TFs of the 4 groups. (b) Bar graph demonstrated the proportion of expression level of NR3C1, MYBL1, CREB5 in groups. ∗p < 0.05, ∗∗p < 0.01, ∗∗∗p < 0.001, ∗∗∗∗p < 0.0001, ns indicates no statistical difference. (c–f) Ranked of regulons in cardiomyopathy groups based on regulon specificity score (RSS). Cardiomyopathy groups were highlighted in UMAP (red dots). Binarized regulon activity score (RAS) of the top regulon of cardiomyopathy groups on UMAP (Z-score normalization was performed for all samples and 2.5 was set as the cutoff value to convert to 0 and 1) (orange dots).
