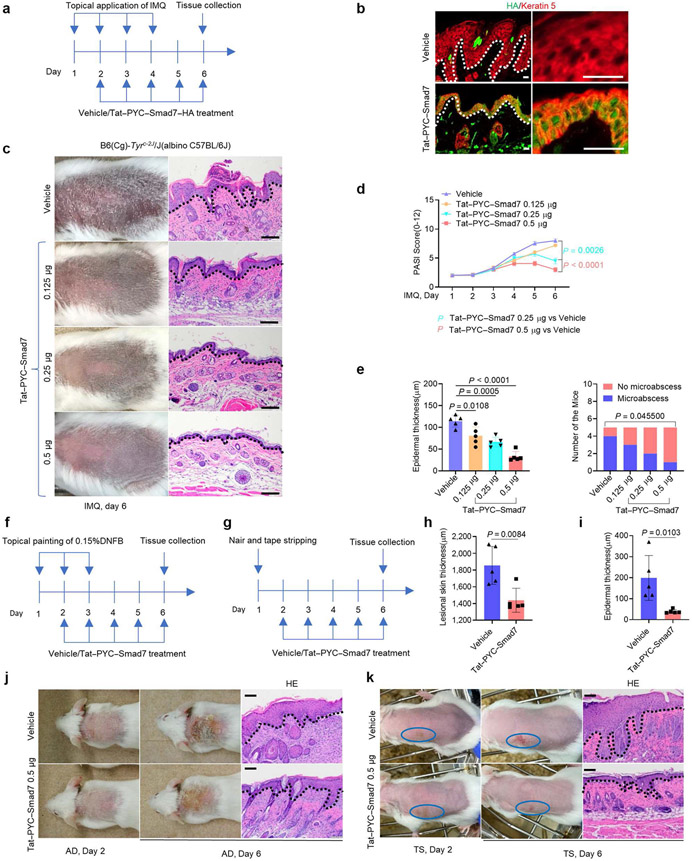
Figure 2. Tat-PYC-SMAD7 treatment ameliorates IMQ-, DNFB-, and Tape stripping-induced skin inflammation.
(a, f, g) Experiment design for Tat-PYC-SMAD7 treatment tests on three skin inflammation models. (b) IF staining of HA-tagged Tat-PYC-SMAD7 2 h after topical application of the 0.5 μg protein on day 6 in the skin, with higher-power frames on the right. (c, j, k) Representative gross images and corresponding H&E skin sections of skin lesions. (d) PASI scores of IMQ-induced skin phenotypes. (e) Quantification of average epidermal thickness (left) and the number of mice (right) in c. Quantification of the average thickness (h) for AD skin and (i) for TS skin. Bars = 25 μm for b and 100 μm for the rest images. Data were assessed using two-way or one-way ANOVA or chi-square test. Data are representative of three independent experiments with five samples per group. Dotted lines: epidermal-dermal boundary. Data represent mean ± SEM. AD, atopic dermatitis; HA, hemagglutinin; IF, immunofluorescent; IMQ, imiquimod; TS, tape stripping.

