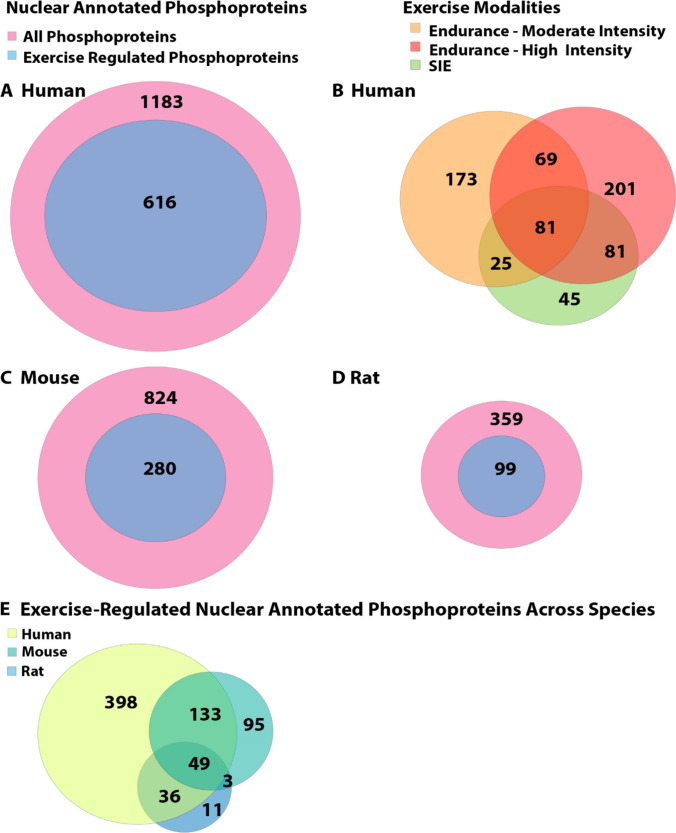
Fig. 6.
Venn diagram displaying subcellular analyses of nuclear-annotated and exercise-regulated proteins identified in existing exercise and skeletal muscle phosphoproteomic databases [153, 154, 156, 157]. Data from each study were first filtered for only significantly regulated phosphoproteins (adjusted P or Q value < 0.05) and then assigned to their respective gene names within each dataset. These gene names were then imputed into database for annotation, visualization and integrated discovery (DAVID) software (51) for gene ontology cellular component (GOCC) analysis (with the analysis performed for each individual species) to identify common and/or unique exercise-regulated genes corresponding to their respective phosphoproteins in human skeletal muscle [154, 156] (A); human skeletal muscle across three different exercise modalities [moderate intensity EX, 60% peak oxygen uptake (O2 peak) and sprint interval exercise (SIE) [156] and high intensity EX (85–92% peak power output (Wmax)] [154] (B); treadmill or wheel running in mice [153, 157] (C); in situ muscle contraction in rats [153] (D); and across all three species (E) that are annotated to reside at the mitochondrion. Phosphoproteins from all comparisons shown in Fig. 6 are listed in Supplementary Table S1

