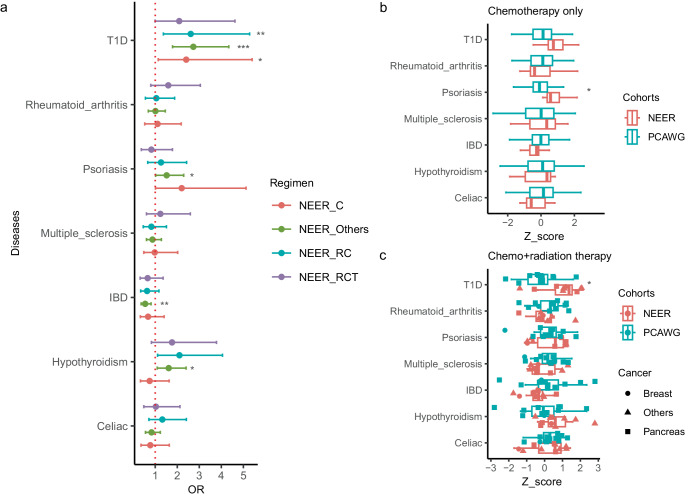
Fig. 3. PRS distributions stratified by regimens.
a Odds ratios (abbreviated as OR) and confidence intervals were plotted, compared to 414 PCAWG typical cancer patients. Different regimens, combinations of therapies, were labeled by different colors. NEER_C (n = 7), NEER_RC (n = 10) and NEER_RCT (n = 7) refer to chemotherapy only, a combination of radiation therapy and chemotherapy, and a combination of radiation therapy, chemotherapy and targeted therapy respectively among NEER ERs. NEER_Others refers to the group of ERs with other combinations of therapies. Each specific combination has a sample size less than 7. b ERs in NEER (n = 7) and patients in PCAWG (n = 52) treated only by chemotherapy were subsetted. Boxplots showed the distributions of their PRSs in different autoimmune diseases. c ERs in NEER (n = 10) and patients in PCAWG (n = 11) treated by both chemotherapy and radiation therapy were subsetted. Boxplots showed the distributions of their PRSs in different autoimmune diseases. The histological cancer types were labeled through the shapes of dots. * signifies p < 0.05 **p < 0.01 ***p < 0.001.

