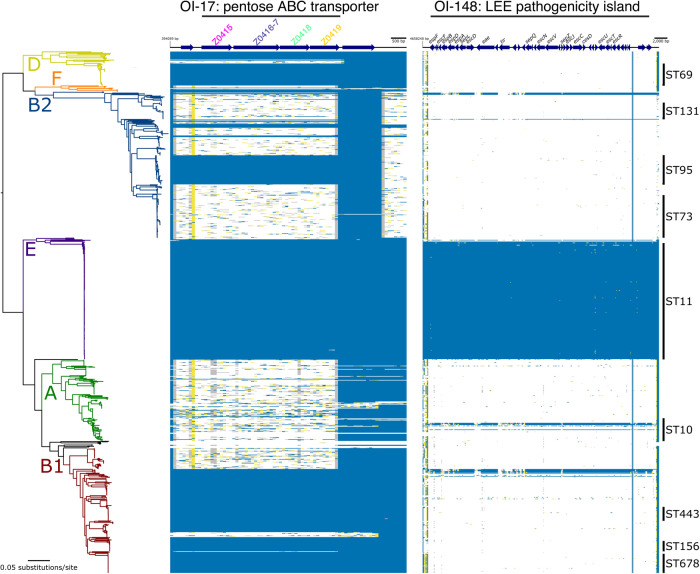
Fig. 1. A horizontally acquired pentose sugar ABC transporter widely encoded by enteric EHEC strains.
Maximum likelihood analysis depicting the core-genome phylogeny of 949 E. coli isolates built from 245,518 core-genome single-nucleotide polymorphisms called against the reference chromosome EDL933. Phylogeny is rooted according to the actual root by Escherichia fergusonii ATCC 35469, which has been omitted for visualisation. Branch colours indicate the six main phylogenetic groups. Branch lengths and scale bar represent the number of nucleotide substitutions per site. The presence/absence of Z0415-9 or the LEE is based on the uniform coverage at each 100 bp window size. Coverage is shown as a heat map where ≥80% of identity is highlighted in blue, ≥50% of identity is highlighted in yellow, and ≥1% is highlighted in grey. White plots indicate absent regions.

