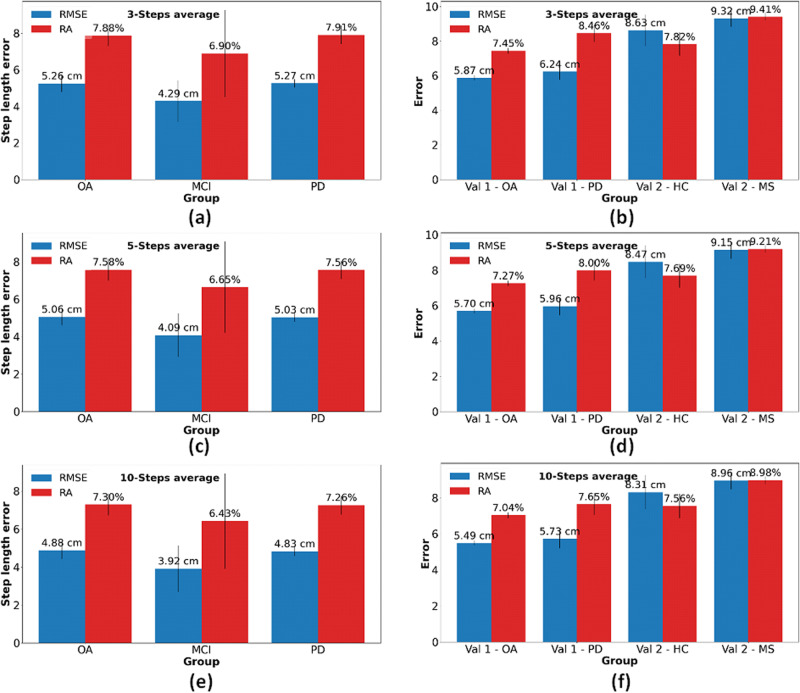
Fig. 4. RMSE and RA of different participants groups for n-steps average.
a Test set (recall Table 1 top panel) with n = 3. b Validation sets with n = 3. c Test set with n = 5. d Validation sets with n = 5. e Test set with n = 10. f Validation sets with n = 10. The blue bars represent the RMSE and the red bars represent the RA. The error bars represent the standard deviation of the fivefolds. The test set refers to Table 1 top panel and the validation sets refer to the middle and bottom panels of Table 1.

