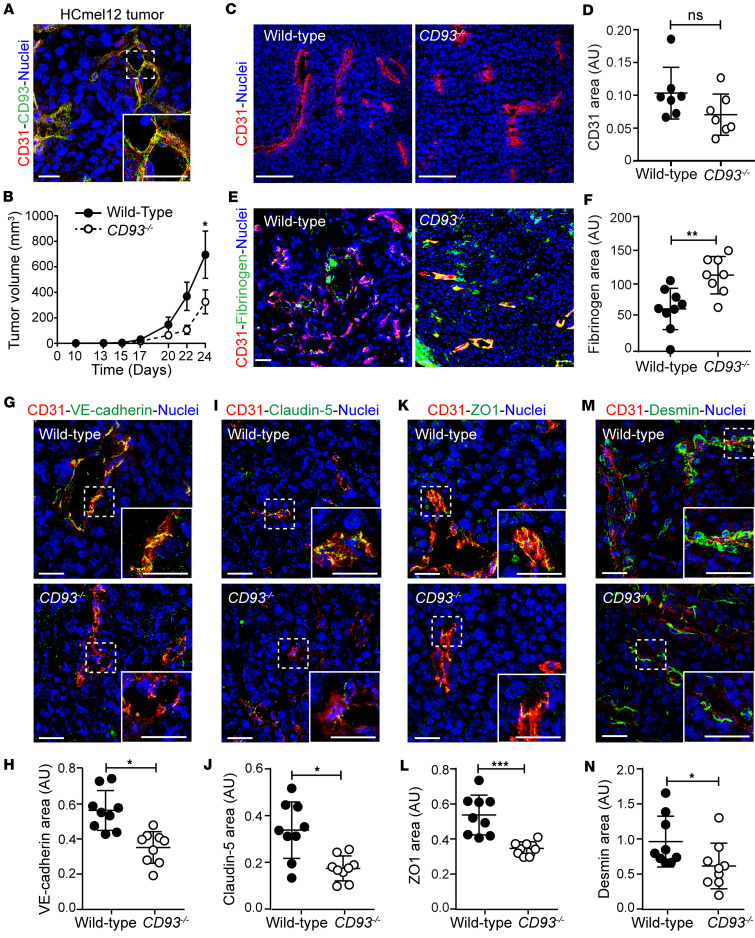
Figure 2. CD93 deficiency impairs subcutaneous HCmel12 melanoma growth and tumor vascular integrity.
(A) HCmel12 tumor stained for CD93 (green), CD31 (red), and with Hoechst (blue). Scale bars: 20 μm. (B) Tumor growth in wild-type and CD93–/– mice (n = 16/group). *P < 0.05 by 2-way ANOVA. (C) Representative images of tumor vessels stained with Hoechst (blue) and for CD31 (red). Scale bars: 100 μm. (D) Quantification of CD31+ area in wild-type and CD93–/– tumors (n = 7/group, 6–8 fields of view/sample). (E) Representative images of fibrinogen leakage (green) and vessels (CD31, red). Scale bar: 150 μm. (F) Quantification of tumor vessel leakage in wild-type and CD93–/– mice (tumor tilescans, n = 8–9/group). Nuclei are visualized by Hoechst (blue). AU, arbitrary units; NS, not significant. **P < 0.01 by 2-tailed t test. Immunofluorescence images for the endothelial junction markers VE-cadherin (green) (G), claudin-5 (green) (I), ZO1 (green) (K), and desmin (green) (M) in HCmel12 tumors. (H, J, L, and N) Quantification graphs represent the area covered by the analyzed endothelial junction markers normalized to the CD31+ area in wild-type (n = 9, minimum of 5 fields of view/sample) and CD93–/– (n = 9 minimum of 5 fields of view/sample) tumors. Scale bars: 20 μm. *P < 0.05, ***P < 0.001 by 2-tailed t test. Values represent mean ± SEM.

