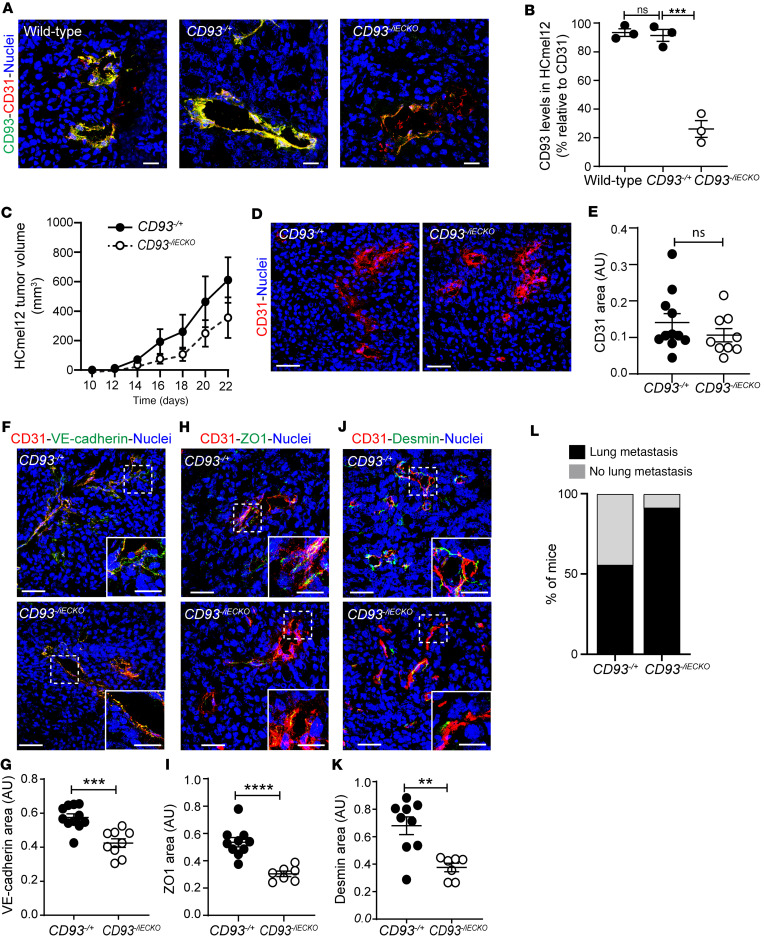
Figure 4. Endothelial cell–specific CD93 deletion impairs HCmel12 vascular integrity and increases metastatic spread.
(A) Immunofluorescent staining showing CD93 levels (green) in HCmel12 tumors implanted in wild-type, CD93 heterozygous (CD93–/+), and CD93–/iECKO mice. Vessels are detected by CD31 (red) and nuclei by Hoechst (blue). Scale bars: 20 μm. (B) Quantification of CD93 levels in HCmel12 vessels of wild-type (n = 3, 3 fields of view/sample), CD93–/+ (n = 3, 3 fields of view/sample), and CD93–/iECKO (n = 3, 3 fields of view/sample) mice. ***P < 0.001 by 1-way ANOVA with Tukey′s multiple-comparison test. NS, not significant. (C) Tumor growth in CD93–/+ and CD93–/iECKO mice (n = 11/group). (D) Representative images of tumor vessels stained for CD31 (red). Scale bars: 25 μm. (E) Quantification of CD31+ area in CD93–/+ and CD93–/iECKO mice (n = 11/group, minimum of 4 fields of view/sample). (F) Representative images of VE-cadherin (green), (H) ZO1 (green), and (J) desmin (green) in HCmel12 tumors from in CD93–/+ and CD93–/iECKO mice. Scale bars: 20 μm and 10 μm (high-magnification insets in F, H, and J). (G, I, and K) Quantification graphs of VE-cadherin, ZO1, and desmin levels normalized by CD31+ area. CD93–/+ (n = 9, minimum of 4 fields of view/sample), CD93–/iECKO (n = 11, minimum of 4 fields of view/sample). AU, arbitrary units. **P < 0.01, ***P < 0.001, ****P < 0.0001 by 2-tailed t test. (L) Percentage of mice that developed lung metastasis 22 days after subcutaneous inoculation of HCmel12 cells (n = 11/group). Values represent mean ± SEM.

