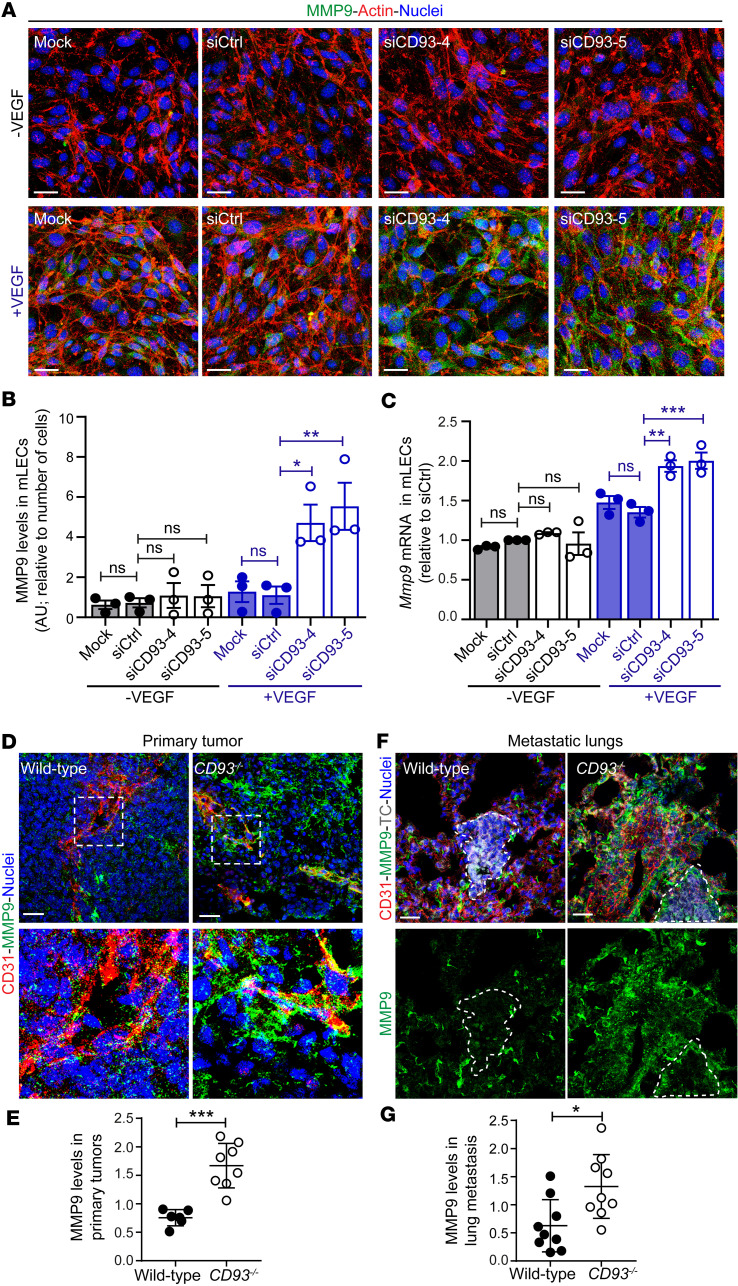
Figure 7. CD93 regulates MMP9 levels in vitro as well as in primary and metastatic sites.
(A) Immunofluorescence images of MMP9 (green) in control mLECs (Mock and siCtrl) and mLECs silenced for CD93 (siCD93-4 and siCD93-5) with/without VEGF (10 ng/mL, 5 minutes). Actin and nuclei were visualized by phalloidin (red) and Hoechst (blue). Scale bars: 20 μm. (B). Quantification of MMP9 levels in mLECs. *P < 0.05, **P < 0.01 by 1-way ANOVA with Tukey′s multiple-comparison test (3 independent experiments). (C) Real-time qPCR showing Mmp9 mRNA levels in control mLECs (mock and siCtrl) and CD93-silenced mLECs (siCD93-4 and siCD93-5) with/without VEGF (3 independent experiments). **P < 0.01, ***P < 0.001 by 1-way ANOVA with Tukey′s multiple-comparison test. (D) Immunofluorescent staining of MMP9 (green) and CD31 (red) in HCmel12 primary tumor from wild-type and CD93–/– mice. Scale bars: 20 μm. (E) Quantification of the area covered by MMP9 normalized to the CD31+ area in wild-type (n = 5) and CD93–/– (n = 7) HCmel12 primary tumor tissue. (F) Immunofluorescent staining of MMP9 (green) and CD31 (red) in metastatic lungs from wild-type and CD93–/– mice. Metastatic lesion of mCherry-HCmel12 tumor cells (TC, gray) are defined by dotted line. Scale bars: 20 μm. (G) Quantification of the area covered by MMP9 around the lung metastatic lesion normalized to the CD31+ area in wild-type (n = 9) and CD93–/– (n = 9) lung metastatic lesions. All immunofluorescence quantifications were performed in a minimum of 4 fields of view/sample. AU, arbitrary units. *P < 0.05; **P < 0.01; ***P < 0.001 by 2-tailed t test (E and G). Values represent mean ± SEM.

