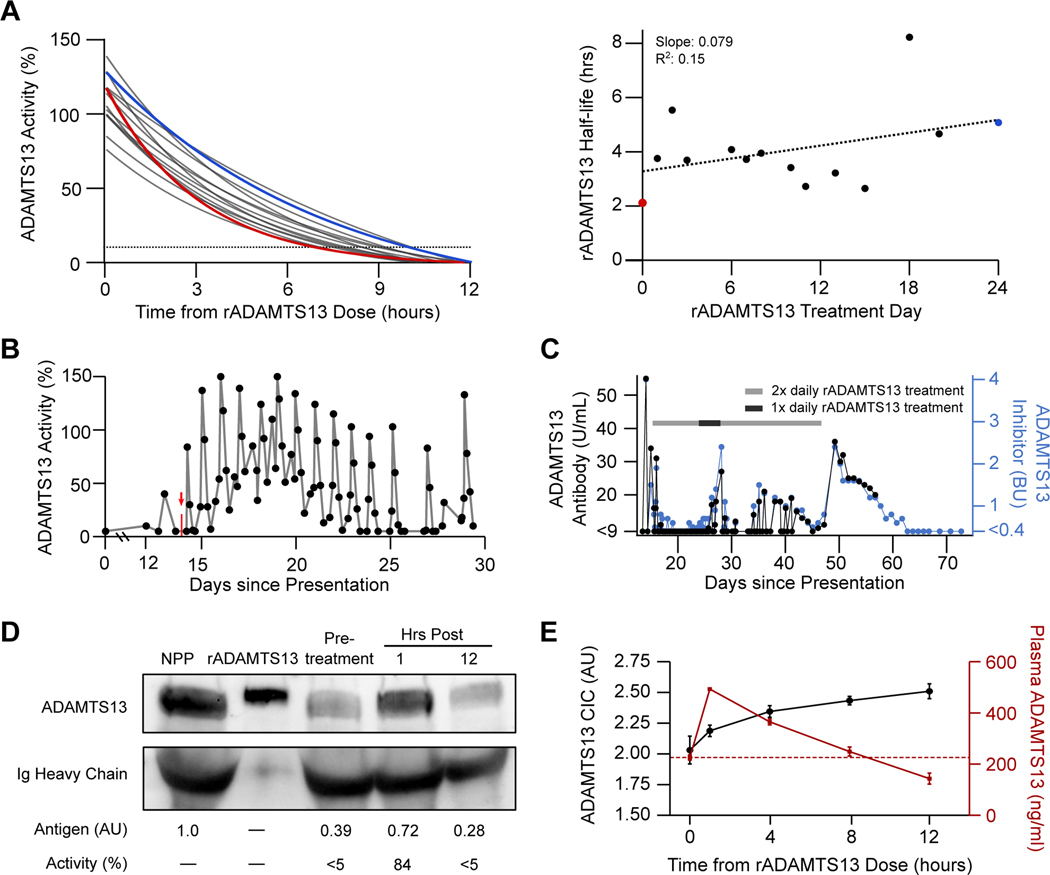
Figure 3. Characterization of Recombinant ADAMTS13 Function in vivo.
Panel A shows serial half-life modeling for rADAMTS13 over 14 non-consecutive days using fitted one-phase exponential decay curves based on ADAMTS13 activity levels measured at 0, 1, 4, 8, and 12 hours after administration (left) as well as the computed ADAMTS13 activity half-life by treatment day (right). The red line and data point represent the first dose, while the blue line and data point represent the 41st dose. The dotted line in the left panel represents 10% ADAMTS13 activity level, the diagnostic cutoff for severe deficiency. The results of simple linear regression analysis are shown in the right panel. Panel B depicts serial ADAMTS13 activity measurements between days 0 and 30. The vertical red arrow and mark denote initiation of intravenous rADAMTS13 treatment. Similarly, ADAMTS13 autoantibody was measured serially via two independent methods (Panel C), including titer in Bethesda-like units (BU) evaluated by FRETS-VWF73 assay (blue) and plasma anti-ADAMTS13 antibody concentration, measured by sandwich ELISA (black). The gray bar denotes periods during which rADAMTS13 (80 IU/kg) was dosed every 12 hours, while the black bar represents dosing every 24 hours. Immunoblotting of patient plasma for ADAMTS13 at 3 timepoints relative to the first dose of rADAMTS13 is shown Panel D alongside normal pooled plasma (NPP) and purified rADAMTS13 in buffer. Corresponding levels of ADAMTS13 antigen (assessed by densitometry) and activity (assessed by FRETS-VWF73 assay) are noted below the image. Assessments of total ADAMTS13 antigen and autoantibody-bound plasma ADAMTS13 levels are shown in Panel E. Sandwich ELISA assays were performed on patient plasma at the indicated times after rADAMTS13 administration to detect total plasma ADAMTS13 (red) and autoantibody-bound ADAMTS13 in the form of circulating immune complexes (CIC) (black). ADAMTS13 CIC concentration is expressed in arbitrary units (AU), while total plasma ADAMTS13 is expressed in ng/ml. Time 0 samples were drawn immediately after daily plasma exchange treatment and prior to administration of rADAMTS13. Data represents the mean (± SD) of four consecutive dosing cycles. The horizontal red dotted line represents the mean baseline plasma ADAMTS13 antigen level at time 0 (225.9 ng/ml).

