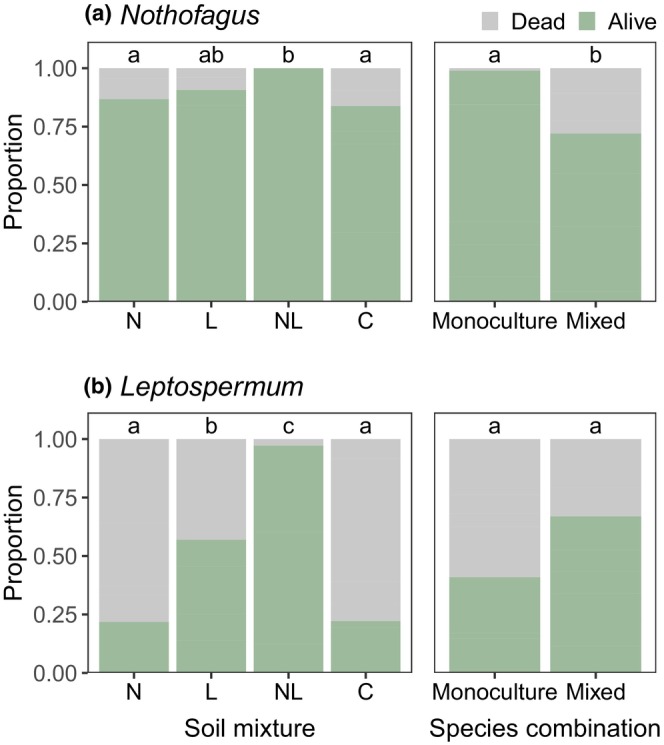
FIGURE 7.

Seedling survival status in different treatments of (a) Nothofagus and (b) Leptospermum in response to drought stress. Seedling biomass was included within each model as a covariate. C = control; L = Leptospermum‐inoculated soil, N = Nothofagus‐inoculated soil, NL = dual‐inoculated soil.
