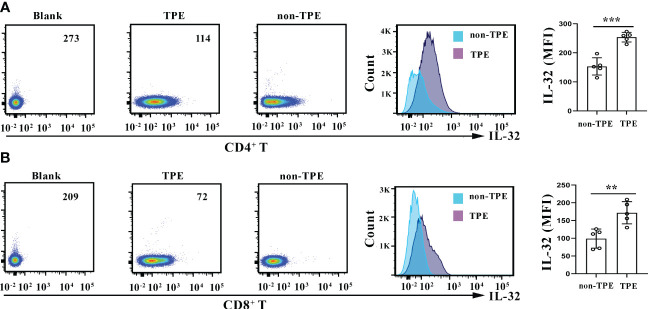
Figure 9.
IL-32 staining in CD4+ and CD8+ T cells. (A) Density plots and overlay histogram showing IL-32 expression in CD4+ T cells in TPE and non-TPE. (B) Density plots and overlay histogram showing IL-32 expression in CD8+ T cells in TPE and non-TPE. MFI, mean fluorescence intensity; TPE, tuberculous pleural effusion. Data are presented as means ± SEM (n = 6). **p < 0.01; ***p < 0.001.

