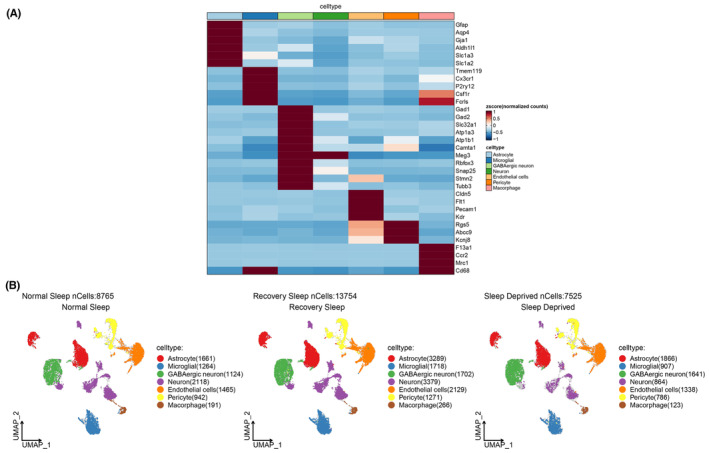
FIGURE 1.

Visualization of cell subgroups' distribution using marker gene expression for normal sleep, 12‐h sleep deprivation, and 12‐h recovery sleep conditions. (A) Expression of marker genes visualized; (B) UMAP visualization of cell subgroup clustering.
