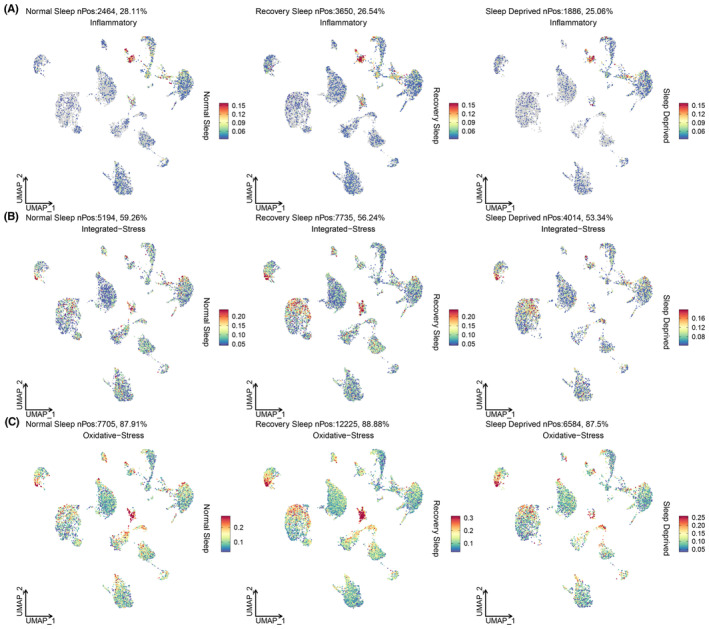
FIGURE 3.

UMAP visualization of the distribution of oxidative stress, inflammation, and integrated stress response gene sets across cell subgroups for normal sleep, 12‐h sleep deprivation, and 12‐h recovery sleep. (A) Visualization of oxidative stress; (B) Visualization of inflammation; (C) Visualization of integrated stress response.
