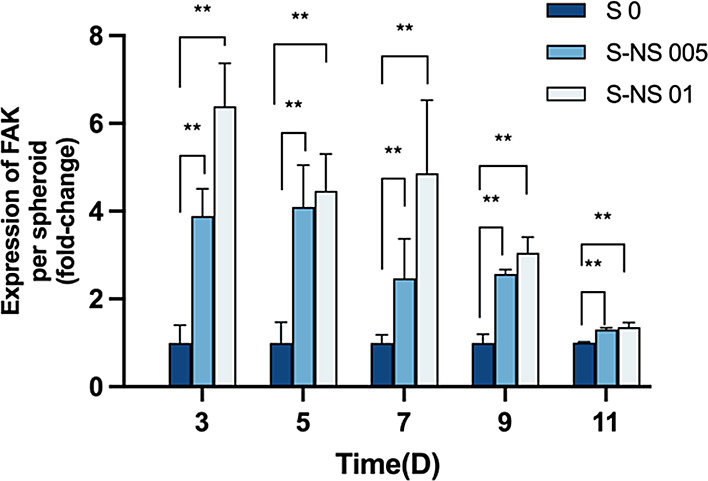
Figure 7.

Fold change of FAK expression level between S 0, S-NS 005 and S-NS 01 (n = 3). Data are represented as mean ± standard error (* p < 0.05 ** p < 0.01).

Fold change of FAK expression level between S 0, S-NS 005 and S-NS 01 (n = 3). Data are represented as mean ± standard error (* p < 0.05 ** p < 0.01).