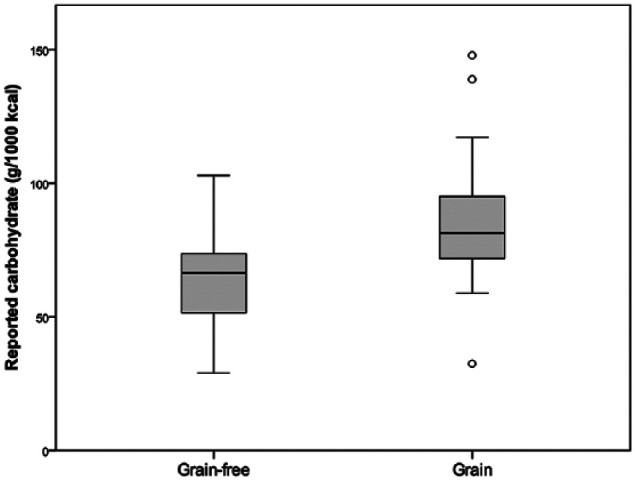
Figure 1.

Box and whisker plot of the carbohydrate content of grain-free and grain-containing dry feline diets. Each box represents the interquartile range (25th–75th percentiles), the horizontal line in each box represents the median value, the whiskers indicate the range of observed values that fall within ± 1.5 times the interquartile range, and circles represent outliers
