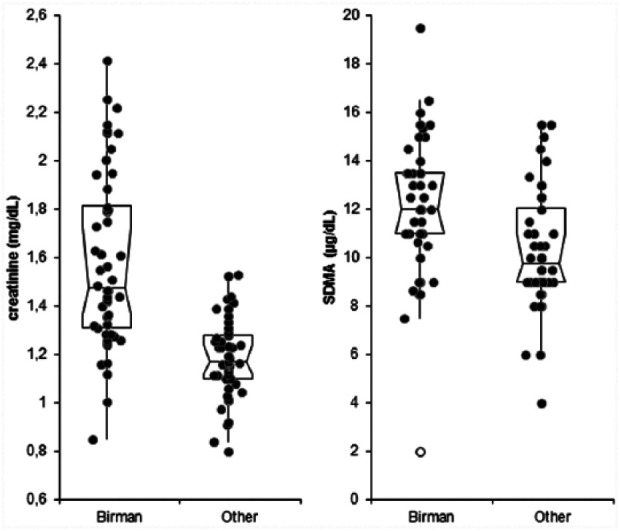
Figure 1.

Distribution of results of creatinine and symmetric dimethylarginine (SDMA) recorded in Birman cats and in cats of other breeds. Boxes indicate the interquartile interval (25th–75th percentile); the horizontal line corresponds to the median value; the vertical lines are the limits of suspected outlier distribution according to the Tukey rule. Each black dot corresponds to an individual value. Far outliers are indicated with the open circles
