
Figure 1.
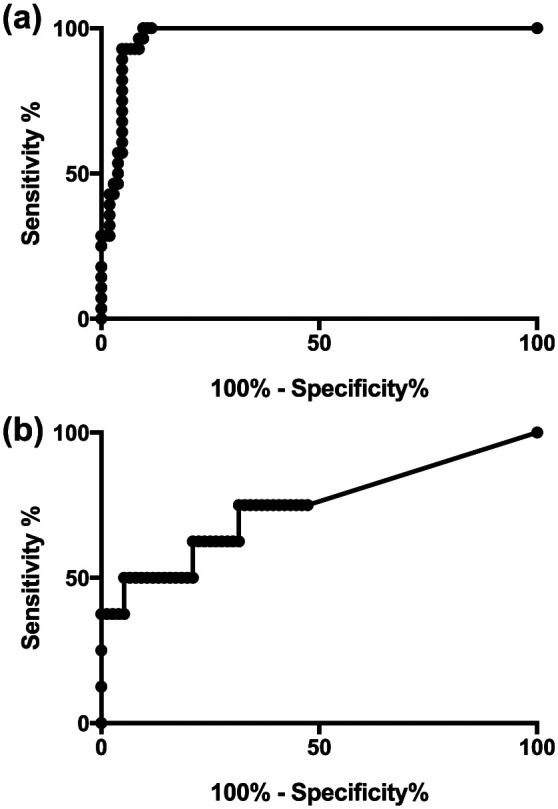
Receiver operating characteristic curves for PCR cycle threshold values. (a) Curve for 28 culture-positive and 104 culture-negative samples prior to treatment; (b) curve for six culture-positive and 76 culture-negative samples during treatment