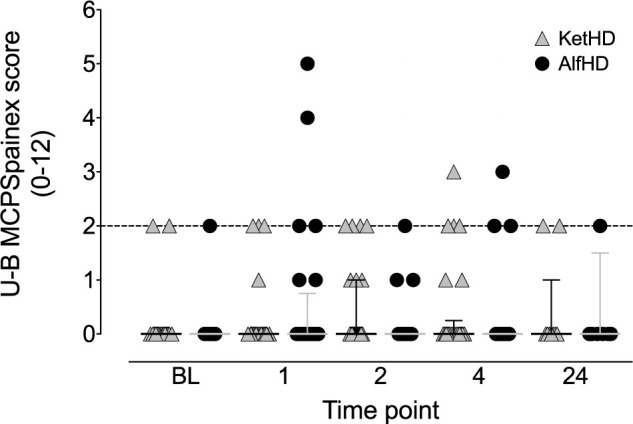
Figure 2.

Plot of pain scale scores for the UNESP-Botucatu multidimensional pain expression subscale (U-B MCPSpainex). The analgesia intervention threshold (>2/12) is indicated by the broken horizontal line. Symbols represent individual data points: ketamine–dexmedetomidine–hydromorphone (gray triangles, n = 26 cats) and alfaxalone–dexmedetomidine–hydromorphone (black circles, n = 24 cats). Data are median and interquartile range. BL = baseline
