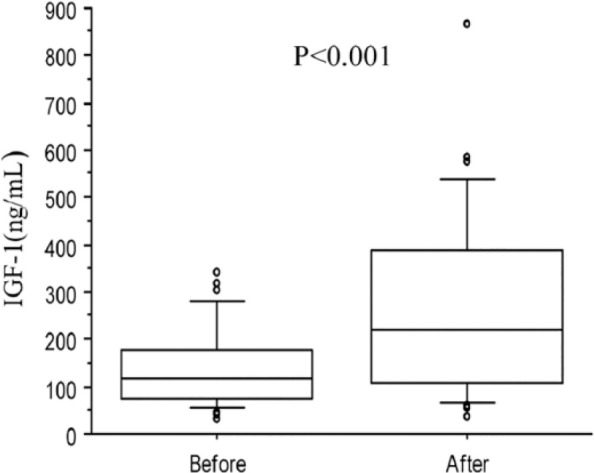
Figure 1.

Box plots of insulin-like growth factor type 1 (IGF-1) concentration in 34 hyperthyroid cats at diagnosis and after thiamazole treatment. The horizontal line in each box represents the median value. The boxes represent the interquartile range (25th and 75th percentiles). Whiskers represent the 5th and 95th percentiles. Outliers are plotted separately as dots
