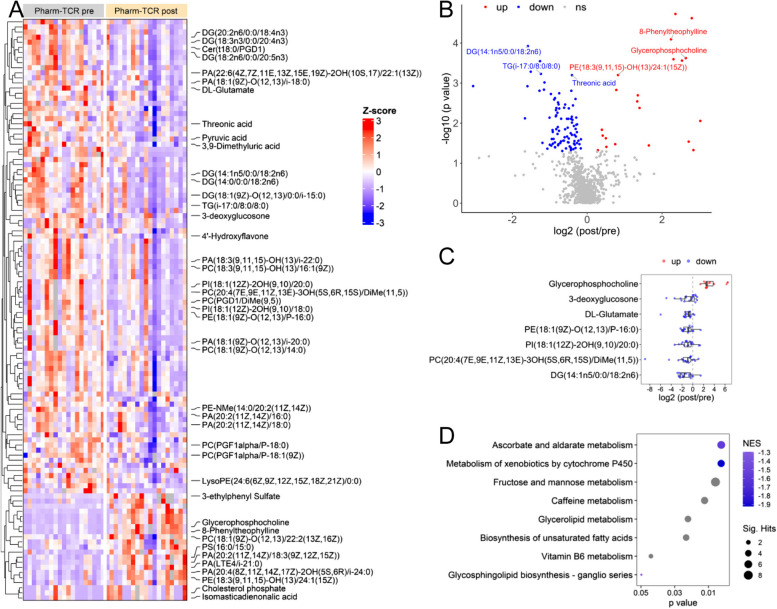
Fig. 1.
Untargeted metabolomics of the plasma sample at post vs. pre pharm-TCR treatment. A The heatmap of all the altered metabolites (p < 0.05), among which the identified metabolites are labelled. B The volcano plot showing the log2 fold change (post/pre treatment) and –log10 (p value) of all detected metabolites. The metabolites with the most significant changes (FDR < 0.05) are labeled. C The log2 fold change (post/pre treatment) of selected metabolites. Each dot represents one participant. D Predicted pathways enriched using integrated Mummichog and GSEA methods. From GSEA, two pathways showed negative NES (normalized enrichment score), suggesting the metabolites in these pathways are mostly downregulated, while other pathways had undetermined directions

