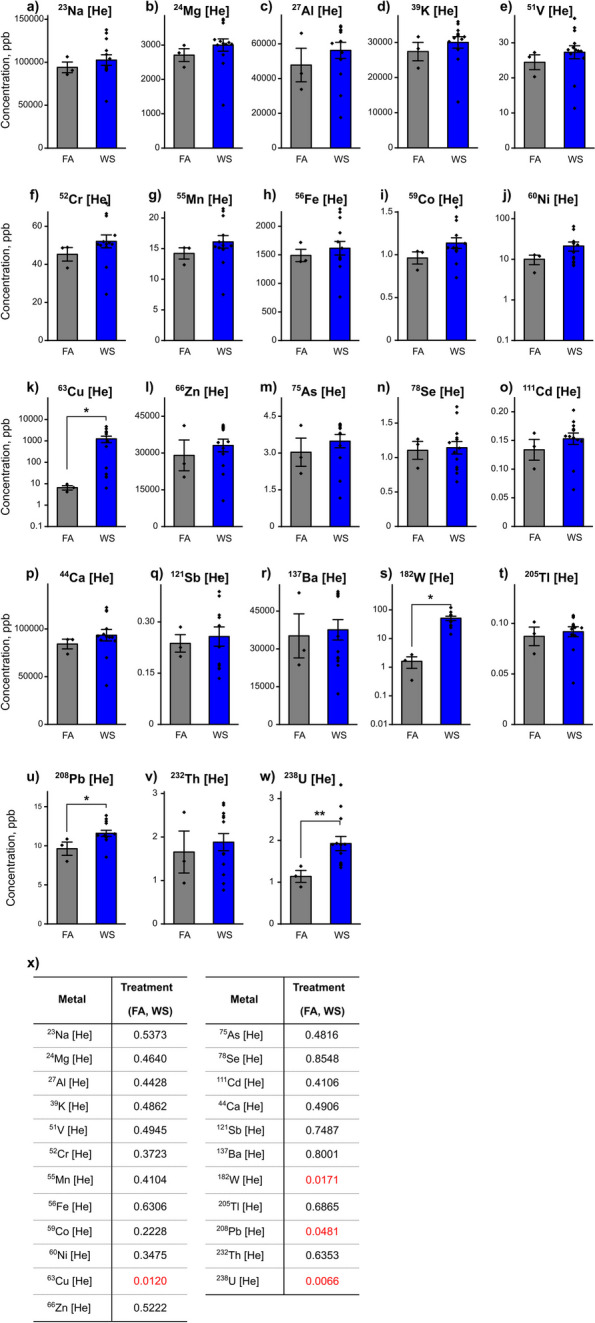
Fig. 2.

Metals analysis of particulate matter (PM) in FA and WS filters. The filters collected gravimetric samples post-inhalation exposure and were analyzed for trace metals (a-w) using inductively coupled plasma mass spectrometry (ICP-MS) methods in triplicate (n = 3) for each group. All measurements were carried out under Helium [He] Mode to reduce potential interferences, and quality control samples were systematically integrated into the data acquisition and data analysis process to ensure data accuracy and reliability. Data were analyzed using the Mann–Whitney test, with (x) indicating the P value for the treatment variable (FA, WS) that influenced changes in metal concentrations (ppb), where P < 0.05 signified statistical significance. Asterisks denote statistically significant mean differences between groups: *P < 0.05; **P < 0.01. Results are presented as mean ± SEM. The real-time measurements of concentrations (ppm, mg/m.3) of NO, CO, and O3 gases in the WS exposure chamber are reported in Supplemental Fig S1
