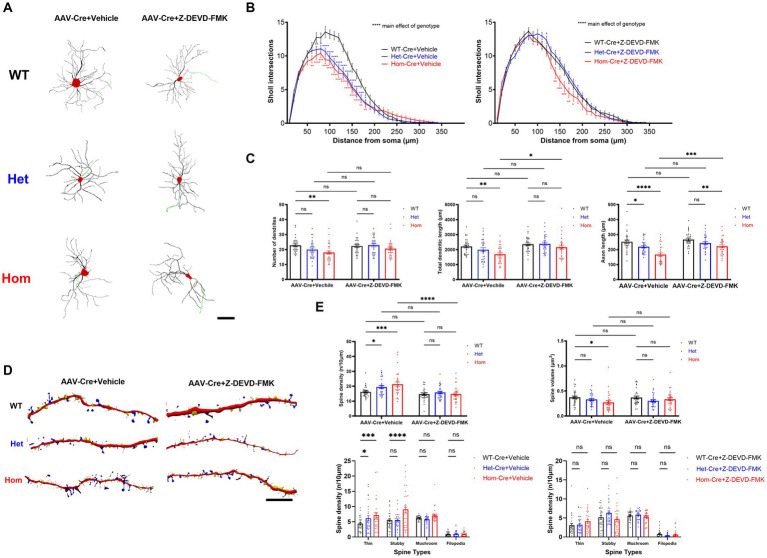
Figure 4.
Cul3 regulates dendritic complexity and spine generation through caspase-3 activity in primary cultured hippocampal neurons. (A) Representative tracings (derived from Neurolucida 360 analysis of confocal images) of WT, heterozygous, and homozygous fCul3 cultured hippocampal neurons treated with Z-DEVD-FMK or vehicle transduced with AAV-Cre-GFP viruses (WT-Cre, Het-Cre, Hom-Cre). Red, cell soma; Black, dendrite; Green, axon. Scale bar, 50 μm. (B) Sholl analysis of WT-Cre, Het-Cre, and Hom-Cre Cul3 knockouts (left) demonstrates significantly decreased dendritic branching in both Het and Hom Cul3 mutant neurons. Decreased dendritic branching is largely reversed by Z-DEVD-FMK treatment in both Het and Hom group (right). (C) Number of dendrites (left), total dendritic length (middle) and axon length (right) significantly decreased in Cul3 homozygous knockout neurons (Hom-Cre) compared to control, fCul3 wildtype treated with AAV-Cre (WT-Cre). Decreased number of dendrites, total dendritic length and axon length were largely reversed by Z-DEVD-FMK treatment in Hom group. (D) Representative tracings (Neurolucida 360 analysis of confocal images) of WT, Het, and Hom fCul3 cultured hippocampal neuronal dendritic spines treated with Z-DEVD-FMK or vehicle transduced with AAV-Cre-GFP viruses (WT-Cre, Het-Cre, Hom-Cre). White, thin; yellow, stubby; blue, mushroom; brown, filopodia. Scale bar, 20 μm. (E) Dendritic spine density significantly increased in heterozygous and homozygous Cul3 knockout neurons were reversed by Z-DEVD-FMK treatment (upper left). Average spine volume significantly reduced in homozygous Cul3 knockout neurons was reversed by Z-DEVD-FMK treatment (upper right). Increased spine density with Cul3 deletion was largely due to increased thin and stubby spines increasing (lower left), and this was reversed by Z-DEVD-FMK (lower right). *p < 0.05, **p < 0.01, ***p < 0.001, ****p < 0.0001, ordinary two-way AVONA with Dunnett’s multiple comparisons test; graphs depict mean ± SEM. N = 30 neurons from 3 separately derived neuronal cultures (10 neurons for each group).

