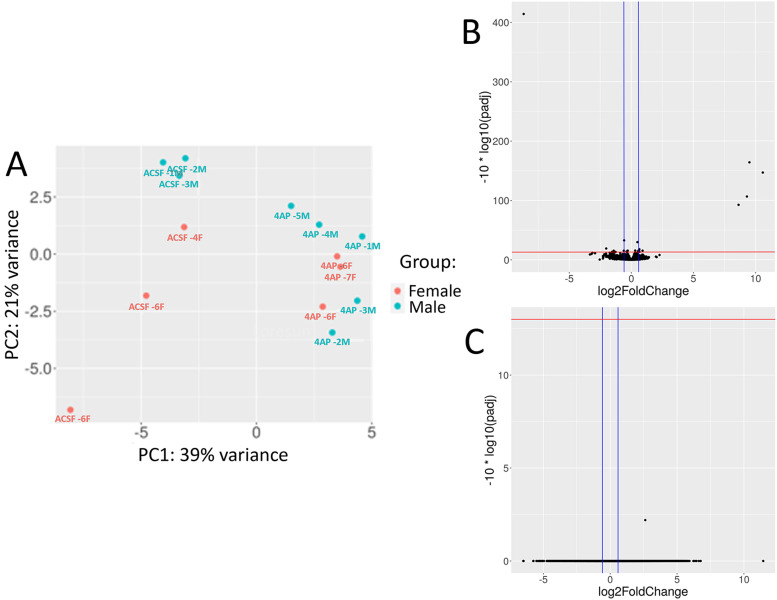
Figure 2.
RNA-seq of male and female slices show no differences between sex in gene expression in response to epileptiform activity. A, PCA plot of the RNA-seq gene expression data from each of the 14 samples separated by sex as shown by the female samples in orange and the males in blue. B, Volcano plot showing DE of genes between male and female samples controlling for treatment condition. Upregulated genes are higher expressed in the male slices, and downregulated genes are present more in the female slices. C, Volcano plot of genes in response to the combination of the sex of the sample and the seizure treatment. Genes are plotted with their log2FC against the −log10(padj). The red horizontal line is at 13 which denotes a FDR = 0.05 and the blue vertical lines are at −0.58 and 0.58 showing the log2FC cutoffs.

