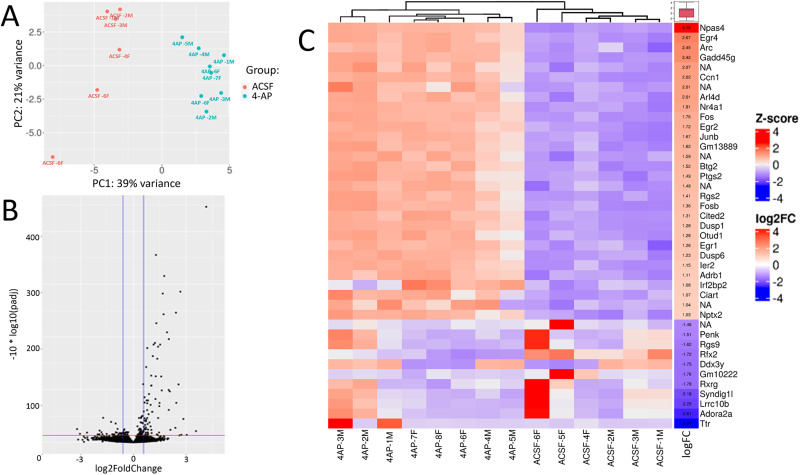
Figure 3.
DE analysis of ex vivo slices shows large-scale gene expression changes in response to 4AP treatment. A, PCA plot of the samples as in Figure 2A, separated by aCSF and 4AP treatment shown in orange and blue respectively. B, Volcano plot as in Figure 2B of the DE genes after seizure induction. C, Heatmap and hierarchical clustering of the top 30 upregulated and 10 downregulated genes for each of the samples shown in a column. A gradient from red to blue represents the expression of the gene in each sample, the red box denotes a higher expression, and a blue box denotes lower expression. The columns show the log2FC value and average expression values for the specific genes. See Extended Data Figure 3-1 for more details.

