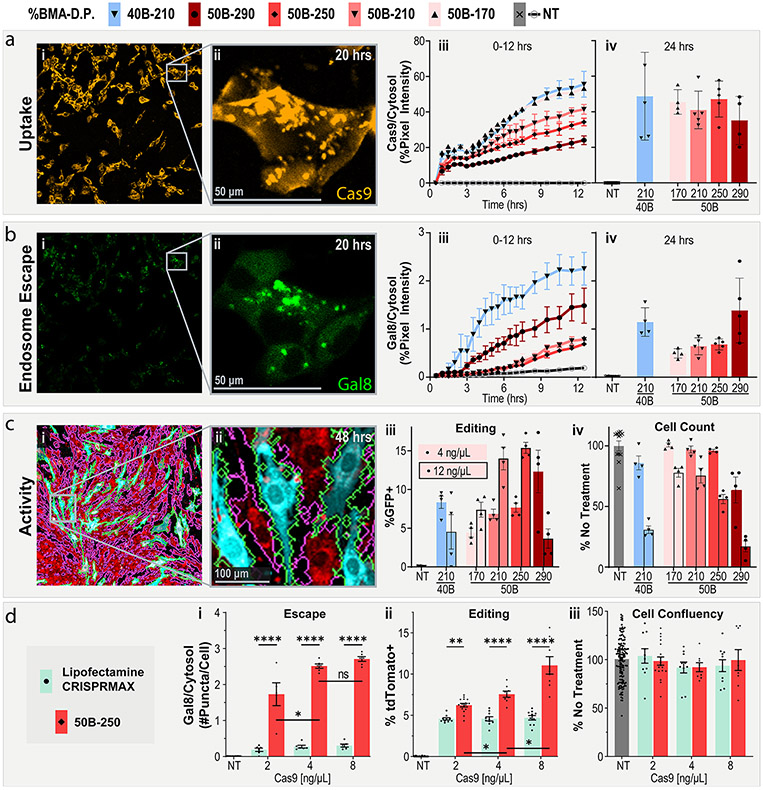
Figure 4.
PEGDB molecular weight affects in vitro RNP delivery and editing. (a) Cell internalization and (b) Gal8 endosomal escape reporter imaging of cells treated with PSiNP-PEGDB nanocomposites. (i) Full-field and (ii) inset confocal microscopy representative images. (iii) Image quantification from 0 to 12 and at (iv) 24 h. (c) Gene editing activity of PSiNP-PEGDB nanocomposites in NIH 3T3 mTmG (tdTomato in red, GFP in teal) reporter cell line. Cell outlines are shown to demonstrate image cytometry recognition of cell area (GFP+ in green, tdTomato+ in pink. (i) Full-field and (ii) inset confocal microscopy example images. (iii) Percentage of cells positive for GFP expression. (iv) Relative cell area quantified from images, a proxy for cell viability. (d) Comparison of RNP delivery with PSiNP-PEGDB nanocomposites vs Lipofectamine CRISPRMAX in NIH 3T3 Ai9 reporter cell line. Quantification of (i) relative Gal8 endosomal escape, (ii) percentage of cells positive for tdTomato expression, and (iii) relative cell area as a proxy for cell viability. All error bars are SEM. All data points represent one well. All statistics result from ANOVA with Tukey’s multiple comparison’s test using GraphPad Prism (*p ≤ 0.05, **p ≤ 0.01, ***p ≤ 0.001, ****p ≤ 0.0001).

