

Summary:
Phenazines are redox-active secondary metabolites produced by diverse bacteria including the opportunistic pathogen Pseudomonas aeruginosa. Extracellular electron transfer via phenazines enhances anaerobic survival by serving as an electron sink for glucose catabolism. However, the specific phenazine reductase(s) used to support this catabolism are unknown. Because electron transport chain components have been previously implicated in phenazine reduction, we sought to determine which of them possess phenazine reductase activity. We show that phenazine-1-carboxamide (PCN) and pyocyanin (PYO) are reduced at the highest rate by cells and are localized to the cell envelope while reduced. Using a coupled genetic and biochemical approach, we show that phenazine reductase activity in membrane fractions is attributable to the three NADH dehydrogenases present in P. aeruginosa and that their order of phenazine reductase activity is Nqr > Nuo > Ndh. In mutants possessing only one functional NADH dehydrogenase, whole cell reduction rates of PCN, but not PYO, recapitulate the pattern of biochemical results, implying that PYO reduction is predominantly occurring in the cytosol. Lastly, we show ubiquinone rapidly and non-enzymatically oxidizes reduced phenazines, demonstrating that phenazines have the capability to serve in a redox loop between the NADH and ubiquinone pools, a finding that carries bioenergetic implications.
Introduction
Phenazines are a class of colorful, redox-active secondary metabolites produced by diverse bacteria, including streptomycetes and pseudomonads (Turner and Messenger, 1986; Glasser et al., 2017a). Commonly characterized as antibiotics due to their toxicity to numerous species (Hassan and Fridovich, 1980; Baron et al., 1989), phenazines nevertheless can also confer a variety of beneficial physiological functions to their producers, including supporting energy conservation, nutrient acquisition, and protection against antibiotics (Wang et al., 2010; McRose and Newman, 2021; Meirelles et al., 2021). Although phenazine reduction underpins all these functions, we lack a mechanistic understanding of how and where it occurs in the cell. A key missing piece has been knowledge of whether a predominant, energy-conserving phenazine reductase exists. Motivating our interest in this problem is the fact that when cells are oxidant-limited, phenazine extracellular electron transfer (EET) acts as an electron sink for glucose catabolism, thereby enabling substrate-level phosphorylation and enhancing long-term anaerobic survival (Glasser et al., 2014). In the absence of EET, P. aeruginosa cannot survive anaerobically via glucose fermentation (Eschbach et al., 2004). It has been proposed that EET may contribute to the survival of the anoxic core of biofilms via redox cycling electrons to peripheral oxygen (Arai, 2011; Dietrich et al., 2013) using a combination of diffusion and electron-hopping mechanisms (Saunders et al., 2020) and play a role in biofilm antibiotic tolerance by promoting a slow metabolic state (Schiessl et al., 2019; VanDrisse et al., 2021). The absence of knowing where phenazine reduction is predominantly catalyzed has hindered our ability to specifically disrupt this metabolism and test this hypothesis.
Prior biochemical work (Glasser et al., 2017b) discovered that the pyruvate dehydrogenase and alpha-ketoglutarate dehydrogenase complexes are potent phenazine reductases. Accordingly, a hypothesis was presented that phenazines could substitute for NAD+ in pyruvate dehydrogenase, and through EET, promote redox balance and sustained flux toward acetyl-CoA and downstream ATP generation via acetate kinase. While this cytosolic mechanism may contribute to phenazine reduction in the whole cell context, the potential for promiscuous reactions of phenazines with various flavoproteins in the cytosol poses a challenge (Imlay, 2013) and would require careful management. Indeed, recent work has shown the phenazine tolerance of Pseudomonas aeruginosa is largely supported in both oxic and anoxic conditions by the expression of RND efflux pumps, which presumably work to keep cellular concentrations of these compounds low (Sakhtah et al., 2016; Meirelles et al., 2021). Accordingly, we wondered whether reduction at another subcellular location might enable beneficial reduction and subsequent export in a manner that would minimize phenazine reduction in the cytosol.
Intriguingly, previous genetic work found phenazine reduction deficits in P. aeruginosa electron transport chain (ETC) mutants, notably mutants of the bc1 complex (Price-Whelan, 2009) and the high-affinity cbb3-type cytochrome c oxidases (Jo et al., 2017). These data suggest that phenazine reduction may occur in part at the inner membrane through some component of the ETC. Given the relatively low midpoint potential of phenazines (Wang and Newman, 2008), it seemed possible that these mutants’ phenazine reduction defect might be due to adaptations in the expression of upstream ETC components, a response to the loss of downstream components that has been previously observed (Calhoun et al., 1993). Consistent with this prediction, it has long been known that NADH dehydrogenases can react with redox-active secondary metabolites (Imlay and Fridovich, 1992; Krishna and Mohan, 2019) and other redox-active compounds (e.g. menadione and phenazine methosulfate) have been used as experimental electron acceptors to assay ETC dehydrogenase activity for decades (Massey and Singer, 1957).
The ETC in P. aeruginosa (Figure 1A) consists of multiple dehydrogenases that feed electrons from the cytosol to a common ubiquinone pool. Ubiquinol can be oxidized by two terminal oxidases that reduce oxygen, the cyanide insensitive oxidase (CIO) and the bo3-type oxidase (CYO). Ubiquinol can also be oxidized by a bc1 complex that reduces a periplasmic cytochrome c pool. While the P. aeruginosa genome contains multiple cytochrome c genes, there is limited knowledge of their individual physiological functions (Arai et al., 2014). The cytochrome c pool can be oxidized by one of three terminal oxidases, the aa3 (COX), cbb3-1 (CCO-1) and cbb3-2 (CCO-2) complexes. Prior studies have found that under most laboratory conditions, including in biofilms, the predominantly expressed terminal oxidases are CCO-1 and CCO-2 (Alvarez-Ortega and Harwood, 2007; Kawakami et al., 2010).
Figure 1: Schematic of P. aeruginosa phenazine biosynthesis and electron transport chain.

(A) Possible electron paths from cytosolic electron donors to oxygen are shown as arrows. Donors’ standard midpoint potentials vs. SHE at pH 7.0 are shown in teal (White et al., 2011). G3P, glycerol-3-phosphate. (B) Phenazine-1-carboxylic acid is synthesized via the gene products of either of two core synthesis operons, and modifications via the gene products shown produce other phenazine derivatives. Structures of the derivatives studied in this work are displayed along with their standard midpoint potentials vs. SHE at pH 7.0 in teal (Wang and Newman, 2008). PCA, phenazine-1-carboxylic acid; PCN, phenazine-1-carboxamide; 5MePCA, 5-methyl-phenazine-1-carboxylic acid; PYO, pyocyanin; 1-OH-PHZ, 1-hydroxy-phenazine.
Here we sought to characterize the interactions of phenazines with the stationary-phase ETC of P. aeruginosa strain PA14 using a coupled genetic and biochemical approach. P. aeruginosa synthesizes multiple phenazines, including phenazine-1-carboxylic acid (PCA), phenazine-1-carboxamide (PCN), 5-methyl-phenazine-1-carboxylic acid (5Me-PCA), pyocyanin (PYO), and 1-hydroxy phenazine (1-OH-PCA) (Figure 1B; (Mavrodi et al., 2001). We focused on the reduction of PYO, PCN, and PCA because they are commonly and consistently secreted into the medium of both planktonic cultures and biofilms (Jo et al., 2020). Our goal was to work towards an integrative model of how and where phenazines are reduced within the cell.
Results
Phenazine derivatives are reduced at different rates by P. aeruginosa
We first asked whether ETC mutations known to cause phenazine reduction deficits affected the reduction of all phenazine derivatives. To control the phenazine concentrations present in the assay, we used a phenazine-null mutant lacking both copies of its core phenazine biosynthesis operon, Δphz1/2. We compared phenazine reduction by this strain to that achieved by mutants in the bc1 complex (Δphz1/2 ΔfbcC) and cbb3-type terminal oxidase complexes (Δphz1/2 Δcco1/2) that were previously found to have PYO and non-specified phenazine reduction deficits, respectively (Price-Whelan, 2009; Jo et al., 2017). Both Δphz1/2 ΔfbcC and Δphz1/2 Δcco1/2 displayed growth phenotypes that were complemented by insertion of the respective gene and operons in trans at the attTn7 site (Figure S1).
Measuring the phenazine reduction rate by non-growing cells can be achieved by monitoring changes in absorbance at wavelengths indicative of the redox state of the phenazine. We observed that the three phenazine derivatives were reduced at different rates by whole cells (Figure 2A). In all strains, PYO was reduced most quickly, and PCN was reduced faster than PCA despite having a lower midpoint potential (Figure 1B). We confirmed that the Δphz1/2 ΔfbcC and Δphz1/2 Δcco1/2 strains displayed PYO reduction phenotypes under our assay conditions (Figure 2A). However, we found that these strains did not have deficits in their PCN or PCA reduction rate, which had not been tested before.
Figure 2: Whole-cell phenazine reduction rates and sub-cellular localization of reduced phenazine derivatives.

(A) Anaerobic phenazine reduction rates by Δphz1/2 cells in a MOPS minimal medium (pH 7.0) lacking a carbon source. Each data point represents an independent biological replicate and error bars represent the 95% confidence interval of the mean. (B) Phenazines were reduced by Δphz1/2 ΔpvdA ΔpchE (phenazine and siderophore null) cells and directly imaged using a fluorescence microscope. Cells were incubated under MOPS (pH 7.0) agar pads and constantly flushed in a sealed stage chamber with N2 gas. Left images, phase contrast; right images, corresponding fluorescence at 395 nm ex / 528 nm em. Right edge is 25 μm, scale bar is 5 μm. Images are representative of two independent experiments with six total fields captured per condition. (C) Background-subtracted average fluorescence profiles drawn along the short axis of 15 random cells per condition. Shaded regions represent the 95% confidence intervals. Representative fluorescence images of single cells are shown for each phenazine derivative. Right edge is 4.1 μm.
Reduced phenazine derivatives differentially localize to the cell envelope
A factor potentially contributing to differential phenazine cellular reduction rate is the phenazines’ sub-cellular localization. While phenazines’ localization in biofilms has been reported (Bellin et al., 2016), to our knowledge there have been no measurements of phenazine localization within single cells. Given our hypothesis that some phenazines react with electron transport chain components in the inner membrane, we sought to directly visualize phenazine localization in vivo. Conveniently, most phenazines are fluorescent when reduced (Sullivan et al., 2011), and can therefore be visualized via fluorescence microscopy after reduction occurs. However, given their rapid reactivity with oxygen, this fluorescence is dependent on maintaining strict anoxic conditions during imaging. To achieve this, we used a small, closed stage chamber with a gas line hookup to constantly flush the microscope stage with N2 gas. We used a strain that cannot synthesize siderophores, Δphz1/2 ΔpvdA ΔpchE, because siderophore fluorescence overlaps spectrally with phenazines (Sullivan et al., 2011). When cells were mounted on agar pads and imaged, we observed a fluorescence increase above background only when phenazines had been added to the pad and the stage was anoxic (Figure S2). Returning a sample with notable fluorescence to oxic conditions also eliminated the fluorescence (Figure S2).
Using this experimental system, we found that both reduced PYO and reduced PCN localized to the cell envelope, forming rings of fluorescence in every cell (Figure 2B). Interestingly, reduced PCN fluorescence displayed noticeably more single-cell heterogeneity than reduced PYO. Average profiles of fluorescence across the short axis of the cell body display a clear bimodal shape for reduced PYO and PCN (Figure 2C). In contrast, reduced PCA fluorescence exhibited a lower signal localized diffusely over the cell body (Figure 2B). The average profile for PCA is unimodally centered over the cell body with a minor but significant intracellular increase in fluorescence relative to autofluorescence measured on a buffer-only agar pad, suggesting little, if any, was retained (Figure 2C). Indeed, PCA is likely excluded from the membrane and only slowly enters the cell because of the charge on its carboxylate moiety at circumneutral pH (pKa ~ 4.2, (Brisbane et al., 1987).
Although our microscope achieves near the upper limit of resolution via conventional fluorescence microscopy, it is too low to distinguish an outer membrane, periplasmic, and/or inner membrane localization for reduced PYO and PCN. We also note that this patterning only revealed the localization of the phenazine after it had been reduced, which is not necessarily the site of reduction. These results nevertheless encouraged a deeper exploration into the interactions of phenazines with the ETC.
PYO reduction catalyzed by membrane fractions occurs at the NADH dehydrogenases
Given the Δphz1/2 Δcco1/2 and Δphz1/2 ΔfbcC ETC mutants displayed a PYO reduction phenotype (Figure 2A) and some reduced phenazine derivatives localize to the cell envelope (Figure 2B), we hypothesized that phenazines were at least in part reduced by some component(s) of the ETC. To determine which component(s) contributed to phenazine reduction, we biochemically characterized the redox reactions of PYO with membrane fractions collected from stationary phase P. aeruginosa grown in LB. PYO was chosen as the representative phenazine because it was reduced at the highest rate by whole cells and was affected by ETC mutations (Figure 2A), suggesting any differences between test conditions would be clearest to distinguish in a biochemical assay using this phenazine. The structure of the P. aeruginosa ETC allows for a deductive approach to finding phenazine reduction sites by first testing dehydrogenases using different cytosolic electron donors, followed by testing downstream reduction sites using electron branch point donors (Figure 1A, blue electron donors). Of the known cytosolic electron donors (i.e., NADH, succinate, lactate, malate, and glycerol-3-phosphate), only NADH caused significant PYO reductase activity (Figure 3A). To ensure the membrane fractions had activity in each of the dehydrogenases being tested, we also assayed them for reduction of a synthetic analogue of their natural electron acceptor, ubiquinone-1 (Ub-1). The membrane fractions showed significant ubiquinone reductase activity for all electron donors tested except glycerol-3-phosphate, indicating the cognate dehydrogenases were present and active in the fractions (Figure 3B). Given the absence of glycerol-3-phosphate:Ub-1 oxidoreductase activity, we cannot comment on the phenazine reductase activity of the glycerol-3-phosphate dehydrogenase (GPDH).
Figure 3: Pyocyanin reductase activity of Δphz1/2 membrane fractions using various electron donors.
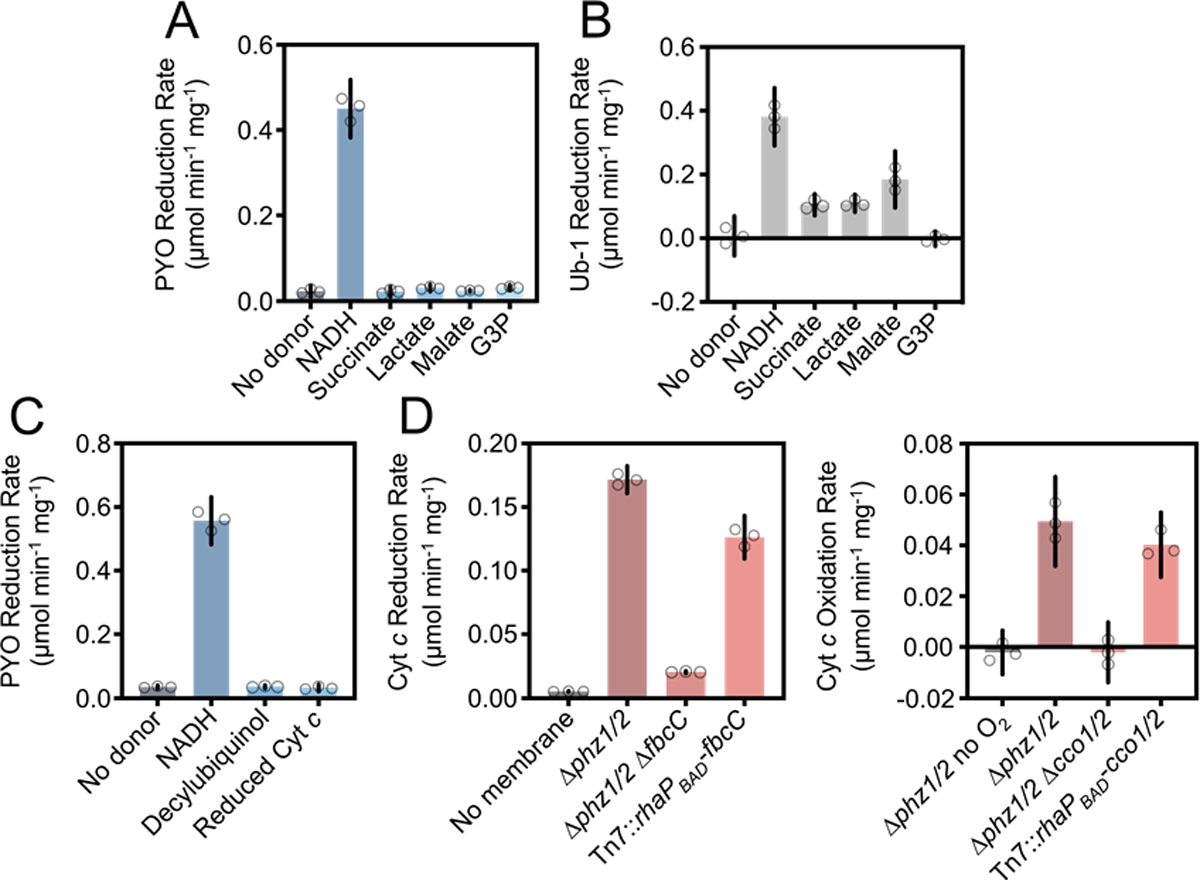
(A) Anaerobic PYO reduction rates using various ETC electron donors. Reaction contained 150 μM PYO and NADH, 1.5 mM of other electron donors, and 0.25 mg mL−1 membrane protein. Reaction buffer contained an oxygen scavenging enzyme system (see Experimental Procedures). (B) Ubiquinone-1 reduction rates using the same electron donors and reaction buffer as in A. Reactions contained 150 μM Ub-1. (C) PYO reduction rates using electron branch point donors, measured as in A. Reactions contained 150 μM decylubiquinol and 75 μM reduced cytochrome c. (D) Cytochrome c reduction and oxidation rates and their activities’ dependence on the fbcC gene and cco1/2 operons, respectively. Complementations (indicated by Tn7::X) were performed in the respective mutant backgrounds. In the cytochrome c oxidation experiment only, all reactions were assayed using air-equilibrated buffer except for the first, where ‘no O2’ indicates inclusion of the oxygen scavenging system. In all plots, data points represent technical replicates, error bars represent the 95% confidence interval of the mean, and data shown are representative of two experiments using independent membrane preparations.
Although these results implicated the NADH dehydrogenases in phenazine reduction, they did not rule out the possibility that electrons were being passed to a downstream reduction site. We tested this scenario by assaying each of the electron branch points in the ETC, namely NADH, ubiquinol, and reduced cytochrome c. However, we observed again that only NADH caused significant PYO reduction (Figure 3C). Because the bc1 and CCO complexes had been implicated in PYO reduction (Figure 2A), we ensured they were present and active in our membrane fractions by assaying the membrane fractions for their respective activities. The fractions showed significant cytochrome c reductase and oxidase activity, and those activities were dependent on the expected genes knocked out in this study (Figure 3D). Altogether, these results show that when grown on LB, the stationary-phase ETC in P. aeruginosa reduces PYO solely through one or some combination of the NADH dehydrogenases.
The Nqr complex has the largest phenazine reductase contribution
We next asked what the relative contribution to PYO reduction was for each of the NADH dehydrogenases. P. aeruginosa contains three NADH dehydrogenases in its genome: the Nuo complex, the Ndh enzyme, and the Nqr complex first identified in Vibrio species (Tokuda and Unemoto, 1984). We made knockouts of these enzymes’ activity by clean deleting the genes encoding their NADH-oxidizing domains, i.e. nuoF, nqrF, and the whole gene in the case of ndh. The Δphz1/2 ΔnuoF mutant displayed a growth phenotype that was complemented by insertion of the nuoF gene in trans at the attTn7 site (Figure S1). The Δphz1/2 ΔnqrF and Δphz1/2 Δndh mutants had no growth defect (Figure S1). Similar growth phenotypes were seen in LB (Figure S3) and are consistent with one prior study of NADH dehydrogenases in P. aeruginosa strain PAO1 (Torres et al., 2019), while contrasting findings in another study in PAO1 that showed none of the NADH dehydrogenase mutations resulted in a growth defect (Hreha et al., 2021). We assayed the mutants’ membrane fractions for NADH:PYO oxidoreductase activity (hereafter abbreviated PYO reductase activity). We also assayed the PYO reductase activity of membrane fractions collected from the clean deletion mutants in the bc1 (Δphz1/2 ΔfbcC) and CCO (Δphz1/2 Δcco1/2) complexes to assess if these strains’ previously observed PYO reduction phenotypes in whole cells could be explained by changes in their membranes’ PYO reductase activity.
Interestingly, there was no decrease in the PYO reductase activity of the membrane fractions of the bc1 and CCO mutants (Figure 4A). Deletion of the ndh gene resulted in no activity change, while deletion of the nuoF and nqrF genes each significantly decreased the activity of the membrane fractions (Figure 4A). However, when also assayed for NADH:Ub-1 oxidoreductase activity, the membrane fractions from Δphz1/2 ΔnuoF and Δphz1/2 ΔnqrF showed a decrease in activity (Figure 4B), so it was possible that the decrease in PYO reductase activity was only due to changes in overall NADH dehydrogenase activity in the membrane fractions. Attempting to clarify our interpretation, we made NADH dehydrogenase double mutants and assayed their activities as well. Multiple attempts to construct an NADH dehydrogenase triple mutant were unsuccessful.
Figure 4: Anaerobic NADH:phenazine and NADH:Ub-1 oxidoreductase activity of NADH dehydrogenase mutant membrane fractions.

(A) PYO reductase activity of ETC mutant membrane fractions using the same reaction conditions as in Figure 3A. Complementations (indicated by Tn7::X) were performed in the respective mutant backgrounds. (B) NADH:Ub-1 oxidoreductase activity of the same membrane fractions as in (A). The reactions contained 150 μM NADH and Ub-1. (C) NADH:Ub-1 oxidoreductase activity of NADH dehydrogenase double mutant membrane fractions. Ndh only, Δphz1/2 ΔnuoF ΔnqrF; Nuo only, Δphz1/2 ΔnqrF Δndh; Nqr only, Δphz1/2 Δndh ΔnuoF. (D) NADH:phenazine oxidoreductase activity of the same membrane fractions as in (C). Reactions contained 150 μM NADH and the indicated phenazine. In all plots, data points represent technical replicates, error bars represent the 95% confidence interval of the mean, and data shown are representative of two experiments using independent sets of membrane preparations.
While all the membrane fractions from the double mutants showed decreased NADH:Ub-1 oxidoreductase activity, the activity was equal between them (Figure 4C), allowing for an even comparison of the relative phenazine reductase activity of each NADH dehydrogenase. In these membrane fractions, we observed a pattern of PYO reductase activity consistent with that of the single mutants, where the membrane fraction containing Nqr only had the highest activity, followed by Nuo only, and lastly Ndh only, which displayed minimal activity above the no membrane protein control (Figure 4D). We also assayed these membrane fractions for their PCN and PCA reductase activity. PCN and PCA were reduced at rates about 20 times slower than PYO, qualitatively but not quantitatively consistent with differences in whole cells (Figure 4D, Figure 2A). Both showed the same pattern of reduction largely dependent on the Nqr complex. From these results, the order of phenazine reductase activity of the NADH dehydrogenases in P. aeruginosa appears to be Nqr > Nuo > Ndh, though this model requires validation with purified proteins.
PCN is predominantly reduced at the inner membrane, while PYO is predominantly reduced in the cytosol
Given the consistent patterns of phenazine reductase activity observed in our biochemical experiments, we asked whether the same patterns of reduction in our NADH dehydrogenase double mutants would be reflected in whole cells. This was tested using the same assay as in Figure 2A. We found that PCN reduction patterns by the NADH dehydrogenase double mutant strains matched the results observed biochemically, while PYO patterns did not (Figure 5). The mutants displayed minor deficits in PYO reduction relative to the overall reduction rate (Figure 5), which together with our biochemical results implied that the majority of PYO reduction in vivo occurs in the cytosol. No significant differences were observed in PCA reduction between the mutants (Figure 5).
Figure 5: Whole cell phenazine reduction rates of NADH dehydrogenase double mutants.

Anaerobic phenazine reduction rates using the same experimental conditions as in figure 1B. Dotted lines equal to the mean reduction rates of the Ndh only mutant, an estimate of the cytosolic reductase contribution to reduction. Each data point represents an independent biological replicate and error bars represent the 95% confidence interval of the mean.
Given the membrane fractions of the Ndh-only strain displayed negligible overall phenazine reduction rates (Figure 4D), we inferred that the phenazine reduction rates by whole cells of the Ndh-only mutant represent an estimate of the cytosolic contribution to the overall reduction rate observed. Assuming the contributions of the cytosol and membrane are additive, the results suggest that among the NADH dehydrogenases, Nuo predominantly contributes to PYO reduction, while Nqr predominantly contributes to PCN reduction in vivo (Figure 5). Variation in the measured reduction rates of PCA prevented any clear conclusion being drawn for it using this analysis.
Phenazines constitute a redox loop between the NADH and ubiquinone pools
We next wanted to test if phenazines competed with Ub-1 for a common reduction site in the NADH dehydrogenases. We found that pre-addition of equimolar Ub-1 to the PYO reductase assay completely abolished PYO reductase activity (Figure 6A). However, an alternative experiment where Ub-1 was added after PYO was fully reduced by membrane fractions revealed that PYO was rapidly oxidized by Ub-1 (Figure 6A) at rates that were too fast to measure with our system. Accordingly, we tested if this reaction depended on the presence of membrane fractions by reducing PYO with limiting dithionite and then adding Ub-1. We found that membrane fractions were not necessary to recapitulate the rapid reaction, and that it also occurred with PCN and PCA (Figure 6B). Given the rapid oxidation of phenazine by Ub-1, we cannot comment on the competition between these substrates for a common binding site in the NADH dehydrogenases. However, together with our previous results implicating NADH as the predominant reductant for phenazine reduction via the ETC (Figure 3A, 3C), these data revealed that phenazines can form a redox loop between the NADH and ubiquinone pools, flux through which is limited by the reduction rate of phenazines. The clear reduction of phenazines observed in our prior anoxic assays (Figure 3, 4) implies that under those assay conditions, any endogenous ubiquinone present in the membrane fractions was rapidly reduced once the reaction was initiated.
Figure 6: Phenazine oxidation by ubiquinone in vitro.

(A) PYO reduction by Δphz1/2 membrane fractions and re-oxidation by Ub-1. Reactions contained 150 μM PYO and Ub-1, 75 μM NADH. All other conditions were the same as described in Figure 3A. (B) Phenazine reduction by dithionite and re-oxidation by Ub-1. Oxidized PYO absorbs at 690 nm such that reduction results in a decrease of absorbance, while reduced PCN and PCA absorb at 440 nm such that reduction results in an increase in absorbance. Reactions contained 150 μM phenazine and Ub-1 in the same reaction buffer as in Figure 3A. Plots are representative of two independent experiments, with axes shown in lower left.
Discussion
Spurred by an interest in the redox mechanisms underlying phenazines’ enhancement of anaerobic survival, we undertook this study to characterize phenazine interactions with the ETC. Phenazine reductase activity of membrane fractions isolated from ETC mutants revealed that the NADH dehydrogenase complex Nqr has the highest phenazine reductase activity in the membrane regardless of the derivative, with lower activity from the Nuo complex and minimal activity from Ndh (Figure 4D). Interestingly, we found that in whole cells, our biochemical results were recapitulated with PCN reduction, but not PYO, implying that PYO is predominantly reduced in the cytosol (Figure 5). The smaller fraction of PYO reduction occurring at the inner membrane is predominantly carried out by the Nuo complex (Figure 5, 7A). This contrasts with PCN, which is predominantly reduced at the inner membrane by the Nqr complex (Figure 5, 7A). We also show that PYO and PCN localize to the cell envelope once reduced (Figure 2B,C), and that phenazines are rapidly and non-enzymatically oxidized by ubiquinone, which would permit the formation of a redox loop between the NADH and ubiquinone pools (Figure 6, 7B).
Figure 7: Working model for sub-cellular distribution of PYO / PCN and their redox reactions with the ETC in P. aeruginosa.

(A) PYO is predominantly reduced in the cytosol, with a smaller contribution at the inner membrane from the Nuo complex.
In contrast, PCN is predominantly reduced at the inner membrane by the Nqr complex.
Our results do not clearly support PCA reduction being predominantly localized to one sub-cellular location. (B) When standard terminal electron acceptors (e.g. oxygen, N-oxides) are absent, a fraction of phenazine reduction occurs at the NADH dehydrogenases (to a degree depending on the phenazine derivative) and can shuttle electrons to distal oxidants. It is unknown if this reduction is coupled to the export of protons. When terminal electron acceptors return, it is possible phenazines form a redox loop between the NADH and ubiquinone pools as an intermediate within the ETC. It is unknown to what extent phenazines outcompete ubiquinone for electrons from NADH dehydrogenases, or to what extent ubiquinone outcompetes oxygen for electrons from reduced phenazines. The respective standard midpoint potentials vs. SHE at pH 7.0 of each redox intermediate are listed below in teal. PHZ, phenazine derivative; UQH2, ubiquinol; UQ, ubiquinone.
Our results clarify previous work that showed mutants in the bc1 complex and cbb3-type cytochrome c oxidase complexes displayed phenazine reduction deficits. In particular, it was found that mutants in the bc1 complex grown planktonically displayed a PYO reduction deficit (Price-Whelan, 2009), and that mutants in the CCO complexes showed biofilm spatial redox profiles consistent with a phenazine-null mutant (Jo et al., 2017). In contrast to the implication that these complexes may act directly as reductases, our results show that changes in the whole cell reduction rates of these mutants are not due to any changes in the phenazine reductase activity of the ETC (Figure 4A). These phenotypes instead likely arise due to indirect effects of perturbing these critical components of metabolism. Indeed, P. aeruginosa’s growth rate is highly dependent on its ETC composition (Arai et al., 2014); Figure S1, S3), and under most conditions it relies on flux through the bc1 complex and the cbb3-type oxidases (Alvarez-Ortega and Harwood, 2007; Kawakami et al., 2010). We speculate that removal of these complexes may cause changes to the steady-state cytosolic flavoprotein concentration to balance metabolic fluxes between the cytosol and the membrane, limiting the number of reaction sites available in the cytosol for PYO reduction. This interpretation is consistent with the fact that whole cell reduction rates of PCN, the derivative that our data suggests is predominantly reduced at the inner membrane, are not significantly affected by mutation of the bc1 complex and the cbb3-type oxidases (Figure 2A).
Though our results suggest PYO is predominantly reduced in the cytosol, a significant fraction appears to also be reduced by membrane NADH dehydrogenases. Paradoxically, in membrane fraction assays employing mutants where only a single NADH dehydrogenase was active, Nqr had the highest PYO reductase activity but in whole cells Nuo appears to make the largest contribution to PYO reduction (Figure 4D, 5). This incongruence is intriguing given the accord between these experiments observed for PCN using the same strains (Figure 4D, 5). It seems likely that these differences may arise from the different chemical properties of the phenazine derivatives that impact their ability to cross membranes, either by diffusion or active transport. Transport presents an important hurdle to phenazine reduction that could be limiting in whole cells but that is eliminated in vitro, and thus a better understanding of phenazine trafficking within the cell is needed—including both enzymatic and non-enzymatic components. Indeed, that PYO localizes to the envelope after reduction (Figure 2B,C) despite being predominantly reduced in the cytosol (Figure 4D, 5) exemplifies that phenazines’ redox state likely affects their subcellular localization. It also seems probable that the rate of PCA reduction is limited by this trafficking in the cell, given it is charged at circumneutral pH and none of the NADH dehydrogenase mutations we tested had any significant effect on whole-cell PCA reduction despite their effect on PCA reduction in vitro (Figure 5, Figure 4D).
Importantly, phenazines, along with many redox-active secondary metabolites, have higher redox potentials than the NADH pool (−320 mV) but lower ones than the quinone pool (+100 mV), meaning they are expected to be reduced before quinones in the ETC. Though lactate and malate both have low enough midpoint potentials to reduce phenazines, the lack of PYO reductase activity in membrane fractions using these donors (Figure 3A) suggests there is some specificity to phenazine reduction. Clarifying the nature of this specificity is a priority for future research that may additionally shed light on where phenazines are reduced within the NADH dehydrogenase complexes. NADH dehydrogenases contain at least two active sites, one for NADH oxidation and the other for ubiquinone reduction. Elucidation of whether phenazines are reduced at the ubiquinone reduction site and if phenazine reduction supports proton pumping via these complexes has important bioenergetic implications (Figure 7B, boxed). The Nqr complex in P. aeruginosa, which displayed the highest phenazine reductase activity (Figure 4D), was recently shown to translocate protons (Raba et al., 2018). Proton translocation via respiration of a self-produced terminal electron acceptor would be advantageous to cells otherwise limited for oxidants, and we hypothesize could be a major contributor to overall energy conservation during phenazine-dependent anaerobic survival.
At a larger scale in the context of mature biofilms, NADH dehydrogenase expression profiles are largely unknown. One prior study in PAO1 using ΔnuoG, ΔnqrF, and Δndh strains found that while the Δndh strain exhibited a Crystal Violet retention deficit, each of the NADH dehydrogenase mutants grew into mature biofilms indistinguishable from wild-type in surface-area and thickness (Hreha et al., 2021), indicating that interchangeability or compensation between the dehydrogenases is possible without affecting biofilm growth yield. However, our results suggest interchangeability does not apply to phenazine reduction given that NADH dehydrogenase mutants had significantly different whole cell reduction rates (Figure 5). Given prior work has implicated PCN as being retained in the interior of the biofilm while PYO occupies the periphery (Bellin et al., 2016; Saunders et al., 2020), investigating how the specificity of phenazine reduction elucidated here corresponds to spatial expression of the dehydrogenases in biofilms is an interesting avenue for future research. Moreover, that PCN reduction is predominantly achieved by the Nqr complex (Figure 5) makes PCN an attractive candidate for being the primary terminal electron acceptor in the biofilm core. We hypothesize that if EET-dependent metabolism occurs in the core, PCN would stimulate the highest net energy conservation compared to other derivatives because its reduction largely circumvents promiscuous phenazine reactions with other flavoproteins in the cytosol, allowing for more specific oxidation of the NADH pool and therefore an increased rate of substrate-level phosphorylation.
While in the absence of oxygen, phenazine reduction may provide a bioenergetic benefit, in the presence of oxygen, reduction at the membrane may carry costs—particularly the loss of reducing equivalents from the downstream ETC and the production of reactive oxygen species (ROS; (Hassan and Fridovich, 1979; Hassan and Fridovich, 1980). In addition to scavenging ROS via superoxide dismutases and catalase (Hassett et al., 1992), the ability to limit phenazines’ reaction with oxygen might help. Our findings suggest that the rapid oxidation of reduced phenazines by ubiquinone has the potential to serve in this capacity. We present a working model of phenazine reduction under different conditions in Figure 7B. When terminal electron acceptors like oxygen or N-oxides become depleted, the availability of ubiquinone becomes limited and the phenazine pool accumulates electrons, serving as an electron shuttle to distant oxidants until oxygen or N-oxides return. Under oxic conditions, the cell stands to dissipate reducing equivalents if phenazines shuttle electrons directly to oxygen. Intriguingly, our results reveal nearly instantaneous phenazine oxidation by quinone in vitro (Figure 6B), while the half-life of reduced phenazine in the presence of oxygen is on the order of minutes under hypoxic conditions (2% oxygen)(Wang and Newman, 2008). Assuming that electron transfer from phenazine to ubiquinone is similarly fast in cells, we hypothesize that under some oxygen concentrations ubiquinone may outcompete oxygen for electrons from phenazines in vivo. It is tempting to speculate that the rapid localization of reduced phenazine to the cell envelope (Figure 2B,C) may aid in this. By outcompeting oxygen, not only would ROS generation be mitigated, but a fraction of electron flux through energy-conserving steps of the ETC could remain intact in the presence of phenazine (Figure 7B). This proposed mechanism would appear most salient to PCN, as the in vitro reduction rate of PCN is slower than the NADH oxidation rate driven by Δphz1/2 membrane fractions when aerobically respiring (0.14 ± 0.03 μmol min−1 mg−1, data not shown), whereas PYO reduction is about four times faster than the aerobic respiration rate and would therefore likely overwhelm the ubiquinol oxidation rate of the ETC. Careful hypoxic studies that allow direct measurements of ETC flux upon addition of reduced phenazine are necessary to test this hypothesis and are a priority for future research.
Experimental Procedures
Bacterial strains and culture conditions
Strains used in this study are listed in Table S1. Experiments were conducted with P. aeruginosa UCBPP-PA14 strains streaked from 15% glycerol freezer stocks onto LB-agar and incubated overnight at 37°C or over two-three days at room temperature. In liquid culture, phenazine biosynthesis occurs during the onset of stationary phase (Price-Whelan et al., 2007) and contributes to the survival of non-growing cell populations, so we chose to assay cells in stationary phase as the relevant physiological state. Since P. aeruginosa PA14 reaches the onset of stationary phase within approximately 6 h in lysogeny broth (LB, Difco) at 37°C, 250 RPM, a standard culture incubation time of 20 h was chosen to ensure the culture population was no longer growing. LB was chosen as the experimental medium to maximize growth yield for membrane collection. For growth experiments confirming proper complementation, growth curves were conducted in 96-well plates in a minimal medium consisting of MOPS (100 mM, pH 7.2, adjusted with NaOH), NH4Cl (50 mM), KH2PO4 (3.7 mM), and MgSO4 (1 mM). The medium was supplemented at the beginning of experiments with FeSO4 (3.6 μM, solubilized fresh) and D-glucose (20 mM). Overnight LB cultures with an OD500nm between 5 and 6 (depending on the growth yield of the strain) were used to inoculate fresh minimal medium on the plate. Growth was measured at 500 nm optical density using a BioTek Epoch 2 plate reader held at 37°C with continuous shaking set to slow at a 4 mm orbit.
Mutant strain construction and complementation
All plasmids used in this work are listed in Table S1. Primers were synthesized by Integrated DNA Technologies and are listed in Table S2. For all molecular cloning, plasmids were constructed using Gibson assembly. Plasmids were chemically transformed into E. coli strain S17 and then conjugated into P. aeruginosa PA14. Mutants were constructed using standard homologous recombination using 1 kb regions flanking the gene(s) of interest in the pMQ30 plasmid (Shanks et al., 2006). Genetic complement strains were constructed by reintroducing the deleted gene or operon in trans at the attTn7 site downstream of glmS in the P. aeruginosa genome using the pJM220 plasmid (Choi and Schweizer, 2006; Jeske and Altenbuchner, 2010). For each complementation, the gene or operon was designed to have its expression driven by a rhamnose-inducible promoter, and accordingly all complementation experiments were conducted using cultures grown in media supplemented with L-rhamnose (0.005% w/v, 305 μM).
Synthesis of PYO
PYO was synthesized from phenazine methosulfate (Fischer) using a protocol described previously (Cheluvappa, 2014) with slight modifications. Changes included eliminating purification of PYO via thin-layer chromatography plates and utilizing dichloromethane in the place of chloroform. PYO was analyzed for purity via high-performance liquid chromatography analysis and was found to be >95% pure. Lyophilized PYO was stored at 4 °C until use. Other phenazines were purchased commercially as solid stocks: phenazine-1-carboxylic acid, Princeton Biomolecular; phenazine-1-carboxamide, Chemscene.
Whole cell phenazine reduction assay
Phenazine reduction by cells was monitored in a clear 96-well plate on a BioTek Synergy HTX plate reader housed in an anaerobic chamber (Coy). Media and plastics were allowed to equilibrate to the anoxic headspace for at least three days in the chamber prior to the experiment. Stationary phase cultures were washed in un-supplemented minimal medium (i.e., without glucose or iron added) twice, resuspended to an OD500nm of 8.0, and then brought into the anaerobic chamber. We found separately that such suspensions of strains with intact respiration (Δphz1/2) and impaired respiration (Δphz1/2 Δcco1/2) depleted oxygen from their medium in 30–45 min, as indicated by the addition of resazurin (10 μM). The cell suspensions’ OD did not change during this time. Therefore, the cell suspensions were left to rest in the chamber for 1 h (without resazurin) before being diluted into N2-sparged, un-supplemented minimal medium (pH 7.0) with 100 μM of the appropriate phenazine to a final OD500nm of approximately 0.4 and final volume of 200 μL. The minimal medium was stored in the anaerobic chamber between experiments and protected from light because MOPS buffer is light-sensitive and can become discolored over time. Absorbance was simultaneously monitored at 440 nm and 690 nm every 2 min for 3 h at 30°C, with continuous shaking set to slow at a 4 mm orbit. Slopes were acquired from the steepest linear regions of the reduction curves, fit using a least-squares regression. The slope of controls lacking phenazine were subtracted from the reduction rates as background and never exceeded 10% of the measured reduction rate. Beer’s law was used to convert absorbance measurements to concentrations for this and all other kinetic absorbance experiments. An average pathlength of 0.525 cm was used, the average measured across the plate. The following phenazine extinction coefficients were used (measured for this study, data not shown): reduced phenazine carboxylic acid (PCA), ε440nm = 2381 M−1 cm−1; reduced phenazine carboxamide (PCN), ε440nm = 5053 M−1 cm−1; oxidized pyocyanin (PYO), ε690nm = 4351 M−1 cm−1.
Anoxic microscopy of reduced phenazines
Reduced phenazines were imaged using a Nikon Eclipse Ti-2 inverted microscope outfitted with a custom OKOLab closed stage insert with a gas line hookup that allowed for constant N2 flushing of the sample during the experiment. Gas flow was controlled through the OKOLab bold line system, and temperature was maintained at 25°C using a secondary OKOLab temperature control vestibule housing the entire stage of the microscope. Stationary phase Δphz1/2 ΔpvdA ΔpchE cultures were spotted under agarose (1% w/v), MOPS (50 mM, pH 7.0), and appropriate phenazine (100 μM) pads. Pads were incubated in the N2-flushing stage insert for 5 min before imaging began. Timelapses were acquired for 1 min with an ORCA-Flash4.0 V3 camera (Hamamatsu) with images taken every second in phase contrast and fluorescence at 395ex/528em through a 100x objective. Excitation light was supplied through a SpectraX LED light engine for a 200 ms exposure, and emission light was passed through a standard GFP filter cube (Semrock) with the excitation filter removed. Final images from the timelapse are shown. Due to large differences in fluorescence brightness between phenazine derivatives, fluorescence LUTs were adjusted independently for each phenazine to maximize ease of visualization.
To quantify the on-cell fluorescence for each phenazine, approximately 2.2 micrometer lines with a 7-pixel width were manually drawn along the short-axis of 15 random cells in the phase contrast images. The corresponding fluorescence values along those lines were averaged across cells, and the minimum value of the average profile was subtracted to compare the fluorescence above background across conditions.
Membrane fractionation
One liter of LB in a 2.8 L baffled flask was inoculated with an overnight LB culture of the strain of interest (OD500nm 3.5 to 6, depending on the growth yield of the strain) to a starting OD500nm of approximately 0.03. The culture was incubated at 37°C and shaken at 150 RPM for 20 h. The cultures were centrifuged at 8000×g to pellet cells. Spheroplasts were formed by resuspending the cell pellet in cold hypertonic solution (0.5M sucrose, 20 mM Tris-HCl, pH 8), adding lysozyme to a final concentration of 150 μg/mL, incubating for 5 min on ice, and then diluting the suspension with cold water to a final concentration of 0.25 M sucrose. MgCl2 was added to a final concentration of 20 mM to stabilize the spheroplasts. The suspension was centrifuged at 6800×g to pellet the intact spheroplasts, which were then resuspended in isotonic solution (0.25 M sucrose, 10 mM Tris-HCl, pH 8). One tablet of Sigmafast™ protease inhibitor cocktail (EDTA-free) was solubilized in a milliliter of isotonic solution and added to the suspension, along with DNase (Sigma), RNase (Sigma), and MgCl2 to final concentrations of 15 μg mL−1, 15 μg mL−1, and 1 mM, respectively. The suspension was lysed by running the sample through an Avestin Emusiflex-c3 homogenizer for 1 min at approximately 17,500 psi with recirculation. The Emulsiflex homogenizer produces a heterogeneous mix of inverted and non-inverted vesicles such that reactions occurring on both faces of the inner membrane can be assayed. Lysate was centrifuged at 8000×g and the supernatant collected to remove intact cells. The lysate was then centrifuged at 38,000×g for 1 h on a Beckman Optima ultracentrifuge to pellet the membrane fraction. Membrane fractions were resuspended in MOPS (50 mM, pH 7.2), KCl (150 mM), N-dodecyl-β-D-maltoside (DDM, 0.05% w/v) and flash-frozen as ~30 μL drops in liquid nitrogen. Frozen droplets were stored at −80°C and thawed as needed. Protein concentration was determined using the Bradford method. Thawed membrane fractions were kept at room temperature during experiments: it was observed that keeping them on ice accelerated precipitation of protein. There was no measurable change in activity of the fractions over the timespan of an experiment.
Membrane fraction biochemical assays
Membrane fractions were assayed for various enzyme activity using a Thermo Scientific Evolution 260 Bio UV-Vis Spectrophotometer housed in an anaerobic chamber (Coy), except for experiments measuring the reduction of ubiquinone-1 at 280 nm (detailed below). Plastics used for experiments were allowed to equilibrate to the anoxic headspace for at least three days. Reactions were conducted in semi-micro polystyrene cuvettes (Greiner) with 500 μL reaction volumes. The reaction buffer consisted of N2-sparged MOPS (50 mM, pH 7.2) and KCl (150 mM) that was stored in the anaerobic chamber and protected from light. At the start of the experiment, the buffer was supplemented with DDM (0.05% w/v) and an oxygen-scrubbing enzyme system which included glucose oxidase (375 nM, Sigma), catalase (750 nM, Sigma), and D-glucose (10 mM). Initial investigations lacking this oxygen scrubbing system were characterized by significant fluctuations between technical replicates and day-to-day experiments using the same reagents. Replicability was sharply improved with its inclusion. Membrane fractions were added to a final protein concentration of 0.25 mg mL−1 for all reactions. Reactions were conducted at room temperature and in all cases were initiated with the addition of the electron donor. In the case of no electron donor controls, reactions were initiated with the addition of membrane protein.
For phenazine reduction experiments, stock phenazine solutions were stored at 4°C and aliquots were brought into the anaerobic chamber. All electron donor solutions were made fresh, solubilized anoxically in un-supplemented reaction buffer (i.e., without DDM or the oxygen-scrubbing enzyme system). This included NADH disodium salt (Sigma), sodium succinate dibasic hexahydrate (Sigma), sodium DL-lactate (Sigma), L-malic acid (MP Bio), and sn-glycerol-3-phosphate lithium salt (Sigma). The reaction was monitored for 1 min for PYO reduction, 4 min for PCN, and 10 min for PCA. Absorbance was measured at the wavelengths listed above to monitor reduction of each phenazine derivative, and the extinction coefficients listed above were again used.
For cytochrome bc1 activity assays, decylubiquinol was prepared by reducing decylubiquinone (Sigma) with sodium dithionite according to a previously published protocol (Rustin, 2008). The decylubiquinol solutions in DMSO were stored in aliquots at −80°C. At the start of each experiment an aliquot was thawed and brought into the anaerobic chamber. Solutions of oxidized bovine cytochrome c (Sigma) were prepared fresh for each experiment, solubilized anaerobically in un-supplemented reaction buffer. Cytochrome c reduction was monitored at 550 nm with an extinction coefficient of ε550nm = 18.5 mM−1 cm−1 (Spinazzi et al., 2012). Final DMSO concentration in each reaction was 0.5% (v/v).
For cytochrome c oxidase activity assays, reduced cytochrome c was prepared fresh for each experiment as described previously (Spinazzi et al., 2012) with the modification of adding anoxically solubilized dithionite in equimolar concentration to reduce a solution of oxidized cytochrome c. The absorbance ratio of 550 nm versus 565 nm of a 20 μM solution was confirmed to be above 10 before use. Air-equilibrated reaction buffer was made fresh for each experiment at the bench (supplemented only with DDM) and brought into the anaerobic chamber. Cytochrome c oxidation was monitored at 550 nm with the same extinction coefficient as above.
For NADH oxidation experiments, ubiquinone-1 (Sigma) was solubilized in DMSO and aliquots stored at −80°C were thawed and brought into the anaerobic chamber. NADH was solubilized fresh and anoxically as above. NADH oxidation was monitored at 340 nm with an extinction coefficient of ε340nm = 6.22 mM−1 cm−1 (Sigma). Final DMSO concentration in each reaction was 0.5% (v/v).
Ubiquinone-1 reduction experiments were assayed on a BioTek HTX plate reader in an anaerobic chamber using a quartz 96-well plate. Reactant concentrations were the same as in phenazine reduction experiments with various ETC electron donors, except with ubiquinone-1 as the acceptor and in 200 μL reaction volumes. Reduction was monitored at 280 nm with an extinction coefficient of ε280nm = 6.03 mM−1 cm−1 (measured for this study, difference between oxidized and reduced extinction coefficients, data not shown).
Phenazine oxidation by ubiquinone-1 experiments were conducted using the same reaction buffer as above. Dithionite was solubilized anoxically in un-supplemented reaction buffer and added in equimolar concentration to the phenazine for each reaction.
Data analysis and plotting
Data processing and analysis were done in Python 3.7. Image processing and analysis were done in ImageJ 1.52. Plotting and 95% confidence interval calculations were done in GraphPad Prism 9.
Supplementary Material
Acknowledgments:
We thank Dr. Anna Zemke for the gifts of strains that helped initiate this work. We thank Dr. Lars Dietrich, Dr. Inês Trindade, Dr. Chelsey VanDrisse, and Dr. Lev Tsypin for constructive conversations that impacted experimental design. We are grateful to present and former members of the Newman lab for feedback on an earlier version of this manuscript. This research was supported by NIH grant 1R01AI127850–01A1 to DKN as well as a gift from the Doren Family Foundation.
Footnotes
References solely in supplement: (Simon et al., 1983; Wang et al., 2011)
References
- Alvarez-Ortega C, and Harwood CS (2007) Responses of Pseudomonas aeruginosa to low oxygen indicate that growth in the cystic fibrosis lung is by aerobic respiration. Mol Microbiol 65: 153–165. [DOI] [PMC free article] [PubMed] [Google Scholar]
- Arai H, Kawakami T, Osamura T, Hirai T, Sakai Y, and Ishii M (2014) Enzymatic characterization and in vivo function of five terminal oxidases in Pseudomonas aeruginosa. J Bacteriol 196: 4206–4215. [DOI] [PMC free article] [PubMed] [Google Scholar]
- Arai H (2011) Regulation and Function of Versatile Aerobic and Anaerobic Respiratory Metabolism in Pseudomonas aeruginosa. Front Microbiol 2: 103. [DOI] [PMC free article] [PubMed] [Google Scholar]
- Baron SS, Terranova G, and Rowe JJ (1989) Molecular mechanism of the antimicrobial action of pyocyanin. Curr Microbiol 18: 223–230. [Google Scholar]
- Bellin DL, Sakhtah H, Zhang Y, Price-Whelan A, Dietrich LEP, and Shepard KL (2016) Electrochemical camera chip for simultaneous imaging of multiple metabolites in biofilms. Nat Commun 7: 10535. [DOI] [PMC free article] [PubMed] [Google Scholar]
- Brisbane PG, Janik LJ, Tate ME, and Warren RFO (1987) Revised Structure for the Phenazine Antibiotic from Pseudomonas fluorescens 2–79 (NRRL B-15132). Antimicrob Agents Chemother 31: 1967–1971. [DOI] [PMC free article] [PubMed] [Google Scholar]
- Calhoun MW, Oden KL, Gennis RB, Mattos M.J. de, and Neijssel OM (1993) Energetic efficiency of Escherichia coli: effects of mutations in components of the aerobic respiratory chain. J Bacteriol 175: 3020–3025. [DOI] [PMC free article] [PubMed] [Google Scholar]
- Cheluvappa R (2014) Standardized chemical synthesis of Pseudomonas aeruginosa pyocyanin. MethodsX 1: 67–73. [DOI] [PMC free article] [PubMed] [Google Scholar]
- Choi K-H, and Schweizer HP (2006) mini-Tn7 insertion in bacteria with single attTn7 sites: example Pseudomonas aeruginosa. Nat Protoc 1: 153–161. [DOI] [PubMed] [Google Scholar]
- Dietrich LEP, Okegbe C, Price-Whelan A, Sakhtah H, Hunter RC, and Newman DK (2013) Bacterial community morphogenesis is intimately linked to the intracellular redox state. J Bacteriol 195: 1371–1380. [DOI] [PMC free article] [PubMed] [Google Scholar]
- Eschbach M, Schreiber K, Trunk K, Buer J, Jahn D, and Schobert M (2004) Long-term anaerobic survival of the opportunistic pathogen Pseudomonas aeruginosa via pyruvate fermentation. J Bacteriol 186: 4596–4604. [DOI] [PMC free article] [PubMed] [Google Scholar]
- Glasser NR, Kern SE, and Newman DK (2014) Phenazine redox cycling enhances anaerobic survival in Pseudomonas aeruginosa by facilitating generation of ATP and a proton-motive force. Mol Microbiol 92: 399–412. [DOI] [PMC free article] [PubMed] [Google Scholar]
- Glasser NR, Saunders SH, and Newman DK (2017a) The colorful world of extracellular electron shuttles. Annu Rev Microbiol 71: 731–751. [DOI] [PMC free article] [PubMed] [Google Scholar]
- Glasser NR, Wang BX, Hoy JA, and Newman DK (2017b) The Pyruvate and α-Ketoglutarate Dehydrogenase Complexes of Pseudomonas aeruginosa Catalyze Pyocyanin and Phenazine-1-carboxylic Acid Reduction via the Subunit Dihydrolipoamide Dehydrogenase. J Biol Chem 292: 5593–5607. [DOI] [PMC free article] [PubMed] [Google Scholar]
- Hassan HM, and Fridovich I (1979) Intracellular production of superoxide radical and of hydrogen peroxide by redox active compounds. Arch Biochem Biophys 196: 385–395. [DOI] [PubMed] [Google Scholar]
- Hassan HM, and Fridovich I (1980) Mechanism of the antibiotic action of pyocyanine. J Bacteriol 141. [DOI] [PMC free article] [PubMed] [Google Scholar]
- Hassett DJ, Charniga L, Bean K, Ohman DE, and Cohen MS (1992) Response of Pseudomonas aeruginosa to pyocyanin: mechanisms of resistance, antioxidant defenses, and demonstration of a manganese-cofactored superoxide dismutase. Infect Immun 60: 328–336. [DOI] [PMC free article] [PubMed] [Google Scholar]
- Hreha TN, Foreman S, Duran-Pinedo A, Morris AR, Diaz-Rodriguez P, Jones JA, et al. (2021) The three NADH dehydrogenases of Pseudomonas aeruginosa: Their roles in energy metabolism and links to virulence. PLoS ONE 16: e0244142. [DOI] [PMC free article] [PubMed] [Google Scholar]
- Imlay J, and Fridovich I (1992) Exogenous Quinones Directly Inhibit the Respiratory NADH Dehydrogenase in Escherichia coli. Arch Biochem Biophys 296: 337–346. [DOI] [PubMed] [Google Scholar]
- Imlay JA (2013) The molecular mechanisms and physiological consequences of oxidative stress: lessons from a model bacterium. Nat Rev Microbiol 11: 443–454. [DOI] [PMC free article] [PubMed] [Google Scholar]
- Jeske M, and Altenbuchner J (2010) The Escherichia coli rhamnose promoter rhaPBAD is in Pseudomonas putida KT2440 independent of Crp–cAMP activation. Appl Microbiol Biotechnol 85: 1923–1933. [DOI] [PubMed] [Google Scholar]
- Jo J, Cortez KL, Cornell WC, Price-Whelan A, and Dietrich LE (2017) An orphan cbb3-type cytochrome oxidase subunit supports Pseudomonas aeruginosa biofilm growth and virulence. eLife 6: e30205. [DOI] [PMC free article] [PubMed] [Google Scholar]
- Jo J, Price-Whelan A, Cornell WC, and Dietrich LEP (2020) Interdependency of Respiratory Metabolism and Phenazine-Associated Physiology in Pseudomonas aeruginosa PA14. J Bacteriol 202. [DOI] [PMC free article] [PubMed] [Google Scholar]
- Kawakami T, Kuroki M, Ishii M, Igarashi Y, and Arai H (2010) Differential expression of multiple terminal oxidases for aerobic respiration in Pseudomonas aeruginosa. Environ Microbiol 12: 1399–1412. [DOI] [PubMed] [Google Scholar]
- Krishna KV, and Mohan SV (2019) Purification and Characterization of NDH-2 Protein and Elucidating Its Role in Extracellular Electron Transport and Bioelectrogenic Activity. Front Microbiol 10: 880. [DOI] [PMC free article] [PubMed] [Google Scholar]
- Massey V, and Singer TP (1957) Studies on succinic dehydrogenase: VI. The reactivity of beef heart succinic dehydrogenase with electron carriers. J Biol Chem 229: 755–762. [PubMed] [Google Scholar]
- Mavrodi DV, Bonsall RF, Delaney SM, Soule MJ, Phillips G, and Thomashow LS (2001) Functional analysis of genes for biosynthesis of pyocyanin and phenazine-1-carboxamide from Pseudomonas aeruginosa PAO1. J Bacteriol 183: 6454–6465. [DOI] [PMC free article] [PubMed] [Google Scholar]
- McRose DL, and Newman DK (2021) Redox-active antibiotics enhance phosphorus bioavailability. Science 371: 1033–1037. [DOI] [PMC free article] [PubMed] [Google Scholar]
- Meirelles LA, Perry EK, Bergkessel M, and Newman DK (2021) Bacterial defenses against a natural antibiotic promote collateral resilience to clinical antibiotics. PLoS Biol 19: e3001093. [DOI] [PMC free article] [PubMed] [Google Scholar]
- Price-Whelan A, Dietrich LEP, and Newman DK (2007) Pyocyanin alters redox homeostasis and carbon flux through central metabolic pathways in Pseudomonas aeruginosa PA14. J Bacteriol 189: 6372–6381. [DOI] [PMC free article] [PubMed] [Google Scholar]
- Price-Whelan AM (2009) Physiology and Mechanisms of Pyocyanin Reduction in Pseudomonas aeruginosa. https://resolver.caltech.edu/CaltechETD:etd-02182009-100346. Accessed October 17, 2022.
- Raba DA, Rosas-Lemus M, Menzer WM, Li C, Fang X, Liang P, et al. (2018) Characterization of the Pseudomonas aeruginosa NQR complex, a bacterial proton pump with roles in autopoisoning resistance. J Biol Chem 293: 15664–15677. [DOI] [PMC free article] [PubMed] [Google Scholar]
- Rustin P (2008) Mitochondrial Respiratory Chain. In Laboratory Guide to the Methods in Biochemical Genetics. Blau N, Duran M, and Gibson KM. (eds). Springer. [Google Scholar]
- Sakhtah H, Koyama L, Zhang Y, Morales DK, Fields BL, Price-Whelan A, et al. (2016) The Pseudomonas aeruginosa efflux pump MexGHI-OpmD transports a natural phenazine that controls gene expression and biofilm development. Proc Natl Acad Sci USA 113: E3538–47. [DOI] [PMC free article] [PubMed] [Google Scholar]
- Saunders SH, Tse ECM, Yates MD, Otero FJ, Trammell SA, Stemp EDA, et al. (2020) Extracellular DNA promotes efficient extracellular electron transfer by pyocyanin in Pseudomonas aeruginosa biofilms. Cell 182: 919–932.e19. [DOI] [PMC free article] [PubMed] [Google Scholar]
- Schiessl KT, Hu F, Jo J, Nazia SZ, Wang B, Price-Whelan A, et al. (2019) Phenazine production promotes antibiotic tolerance and metabolic heterogeneity in Pseudomonas aeruginosa biofilms. Nat Commun 10: 762. [DOI] [PMC free article] [PubMed] [Google Scholar]
- Shanks RMQ, Caiazza NC, Hinsa SM, Toutain CM, and O’Toole GA (2006) Saccharomyces cerevisiae-based molecular tool kit for manipulation of genes from gram-negative bacteria. Appl Environ Microbiol 72: 5027–5036. [DOI] [PMC free article] [PubMed] [Google Scholar]
- Simon R, Priefer U, and Pühler A (1983) A Broad Host Range Mobilization System for in vivo Genetic Engineering: Transposon Mutagenesis in Gram Negative Bacteria. Nat Biotechnol. [Google Scholar]
- Spinazzi M, Casarin A, Pertegato V, Salviati L, and Angelini C (2012) Assessment of mitochondrial respiratory chain enzymatic activities on tissues and cultured cells. Nat Protoc 7: 1235–1246. [DOI] [PubMed] [Google Scholar]
- Sullivan NL, Tzeranis DS, Wang Y, So PTC, and Newman D (2011) Quantifying the dynamics of bacterial secondary metabolites by spectral multiphoton microscopy. ACS Chem Biol 6: 893–899. [DOI] [PMC free article] [PubMed] [Google Scholar]
- Tokuda H, and Unemoto T (1984) Na+ is translocated at NADH:quinone oxidoreductase segment in the respiratory chain of Vibrio alginolyticus. J Biol Chem 259: 7785–7790. [PubMed] [Google Scholar]
- Torres A, Kasturiarachi N, DuPont M, Cooper VS, Bomberger J, and Zemke A (2019) NADH Dehydrogenases in Pseudomonas aeruginosa Growth and Virulence. Front Microbiol 10: 75. [DOI] [PMC free article] [PubMed] [Google Scholar]
- Turner JM, and Messenger AJ (1986) Occurrence, biochemistry and physiology of phenazine pigment production. Adv Microb Physiol 27: 211–275. [DOI] [PubMed] [Google Scholar]
- VanDrisse CM, Lipsh-Sokolik R, Khersonsky O, Fleishman SJ, and Newman DK (2021) Computationally designed pyocyanin demethylase acts synergistically with tobramycin to kill recalcitrant Pseudomonas aeruginosa biofilms. Proc Natl Acad Sci USA 118. [DOI] [PMC free article] [PubMed] [Google Scholar]
- Wang Y, Kern SE, and Newman DK (2010) Endogenous phenazine antibiotics promote anaerobic survival of Pseudomonas aeruginosa via extracellular electron transfer. J Bacteriol 192: 365–369. [DOI] [PMC free article] [PubMed] [Google Scholar]
- Wang Y, and Newman DK (2008) Redox reactions of phenazine antibiotics with ferric (hydr)oxides and molecular oxygen. Environ Sci Technol 42: 2380–2386. [DOI] [PMC free article] [PubMed] [Google Scholar]
- Wang Y, Wilks JC, Danhorn T, Ramos I, Croal L, and Newman DK (2011) Phenazine-1-carboxylic acid promotes bacterial biofilm development via ferrous iron acquisition. J Bacteriol 193: 3606–3617. [DOI] [PMC free article] [PubMed] [Google Scholar]
- White D, Drummond J (James T, and Fuqua Clay. (2011) The physiology and biochemistry of prokaryotes. 4th ed., Oxford University Press, New York. [Google Scholar]
Associated Data
This section collects any data citations, data availability statements, or supplementary materials included in this article.