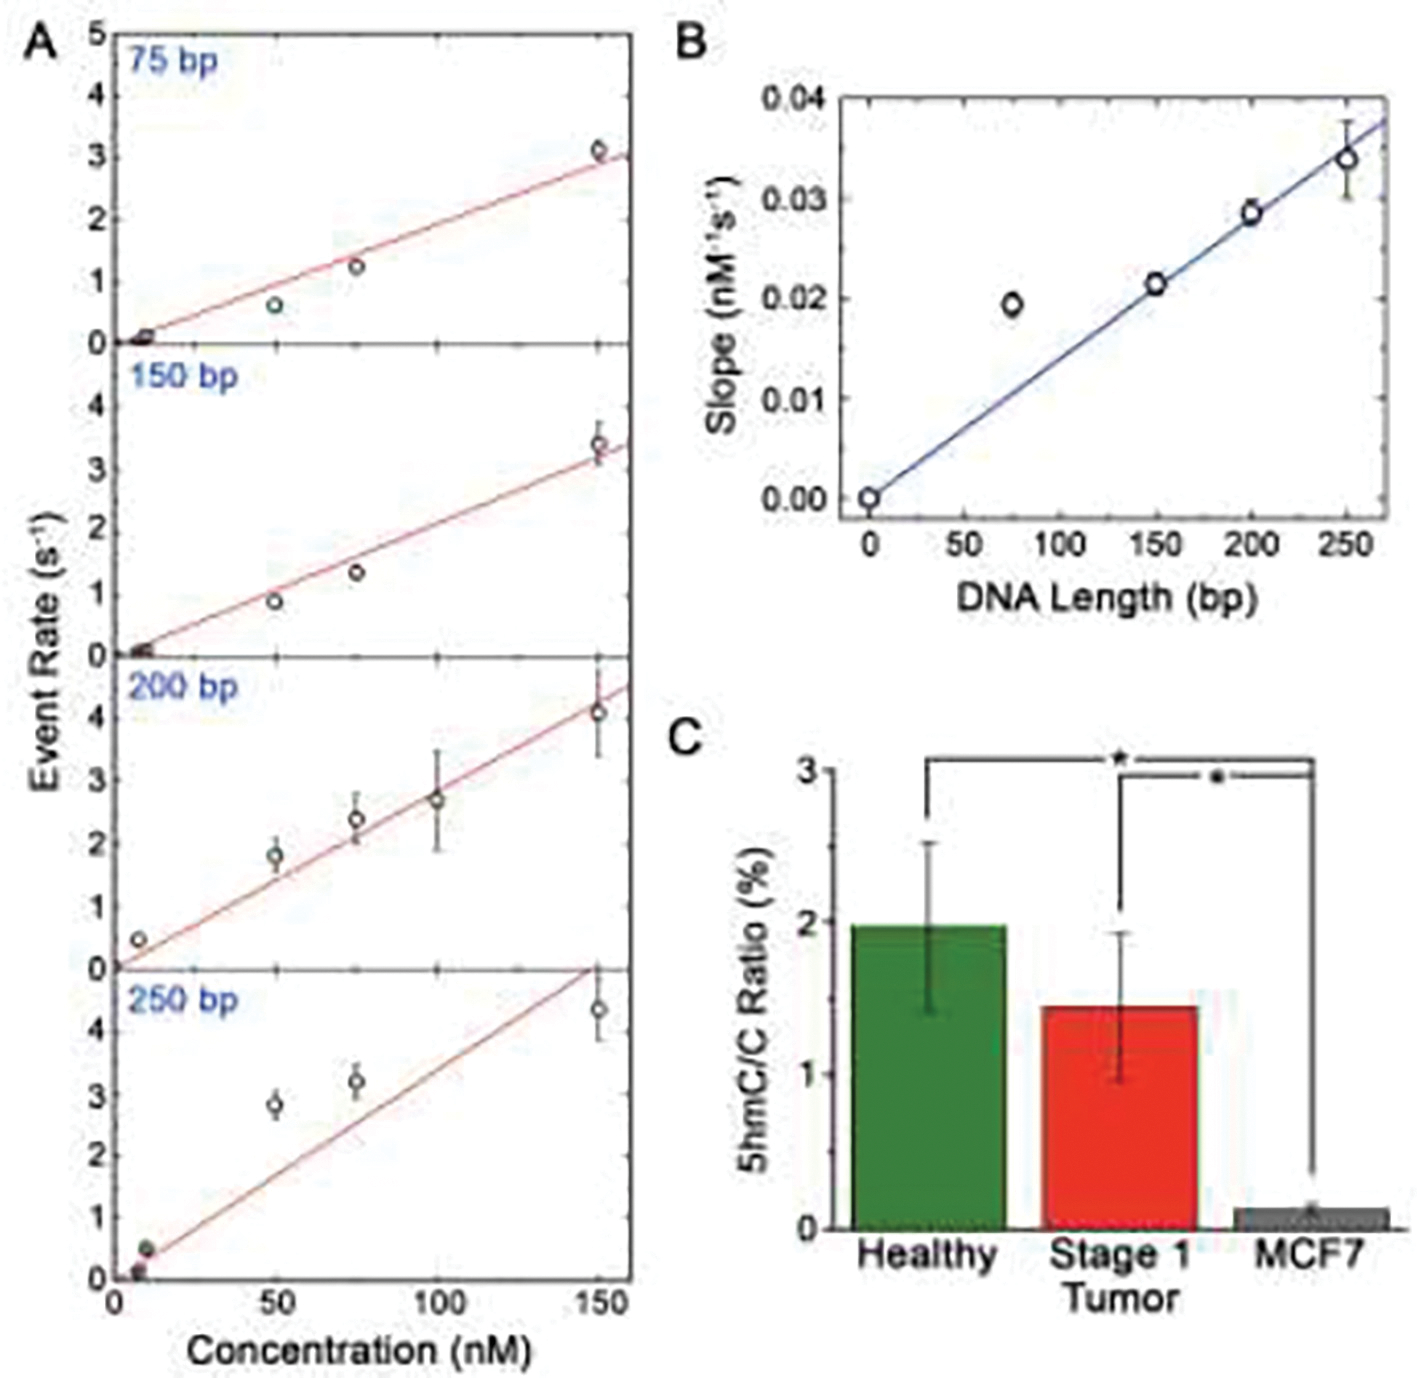
Fig. 4.

(A) SS-nanopore event rates (400 mV applied voltage) as a function of concentration for monobiotinylated dsDNA constructs of different length (75, 150, 200, and 250 bp) bound to MS. Red lines are linear fits to each data set. (B) Dependence of the slopes of the fits in (A) as a function of construct length. Blue line is a linear fit to the data. (C) 5hmC:C ratio for genomic DNA isolated from healthy breast tissue, stage 1 breast cancer tissue, and MCF7 cells taking into account the length-dependent calibration from (B). * p < 0.05.
