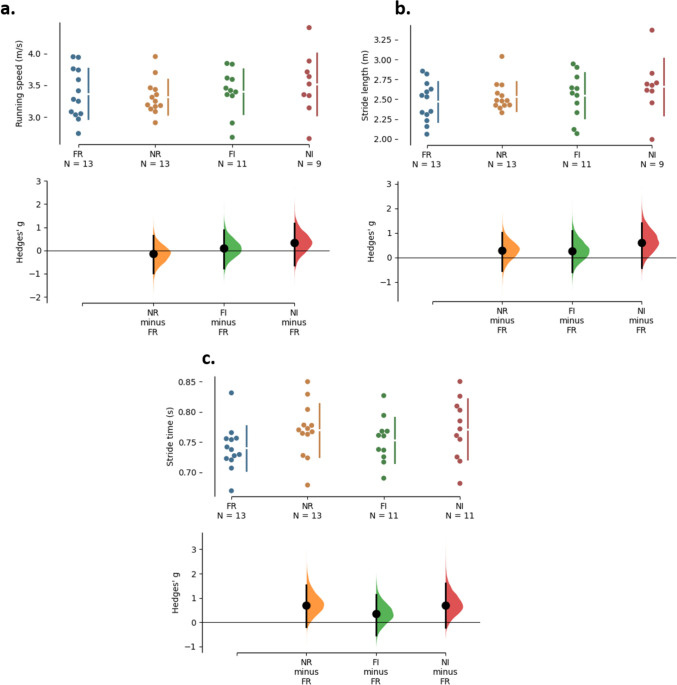
Fig. 1.
Individual response of running speed (a), stride length (b), and stride time in (c) of each participant during running at four conditions: free and Nordic running in regular terrain (FR and NR), and free and Nordic running in irregular terrain (FI and NI). The comparison of the response of each participant is given between free vs. Nordic running in the superior panel, and between regular vs. irregular terrain in the lower panel. Below each plot there are the respective graphical representation of the paired Hedges’ g effect size (mean and 95% confidence interval). The effect size was calculated in relation to the FR condition

