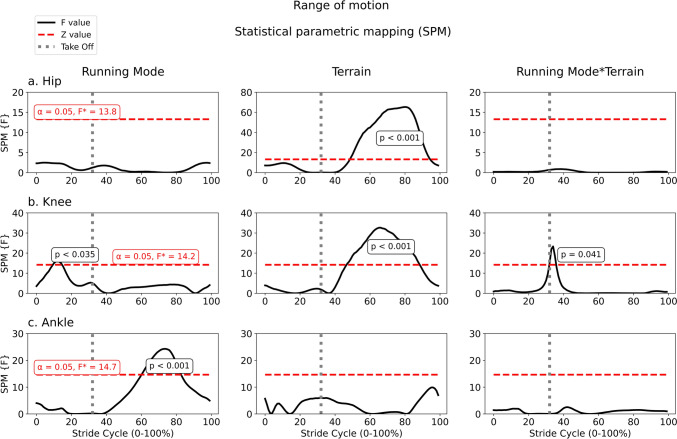
Fig. 3.
Statistical parametric mapping (SPM) using two-way ANOVA with repeated measures to compare the angular position of hip (a), knee (b), and ankle (c) flexion–extension during running at four conditions: free and Nordic running in regular terrain, and free and Nordic running in irregular terrain. Each row is a joint and each column is a factor. The take-off event is indicated by the vertical dashed line. The critical F value and threshold alfa for each analysis are written in red, and they are equal factor within joint. The p-values from the suprathreshold cluster periods of each curve are also indicated

