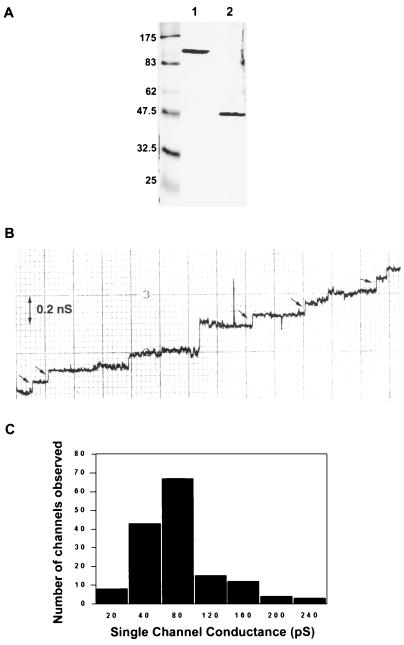
FIG. 1.
(A) SDS-PAGE of purified OprM. The sample was untreated (lane 1) or heated at 100°C for 10 min (lane 2). The molecular masses (in kilodaltons) of the prestained markers in the leftmost lane are indicated on the left. (B) Step increases in single-channel conductance after OprM was added to the aqueous phase (1 M KCl) bathing the lipid bilayer membrane. Each small arrow indicates an increase of 80 pS. (C) Histogram of single-channel conductance increases from more than 150 membrane insertion events. Conductance increases showed a mean distribution (± standard error) of 82 ± 3.8 pS.

