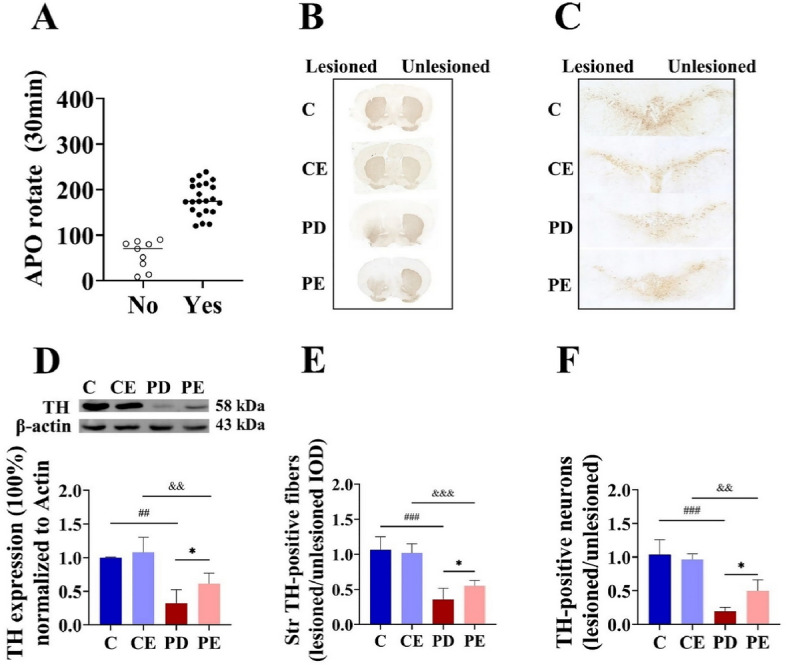
Figure 3.

Evaluation results of PD mouse model (A) Number of APO-induced rota-tions in mice within 30 min; (B,C) Immunohistochemical staining of TH in the striatum and SNpc of each mouse group; (D) TH protein expression in the right striatum (n = 5); (E) Comparison of TH-positive nerve fibers expression in the right/left striatum between mouse groups (n = 6); (F) Comparison of TH-positive cells in the right/left SNpc (n = 4). For statistical significance comparisons, the following symbols were used: ##C vs PD, P < 0.01; ###C vs PD, P < 0.001; *PD vs PE, P < 0.05; &&CE vs PE, P < 0.01.
