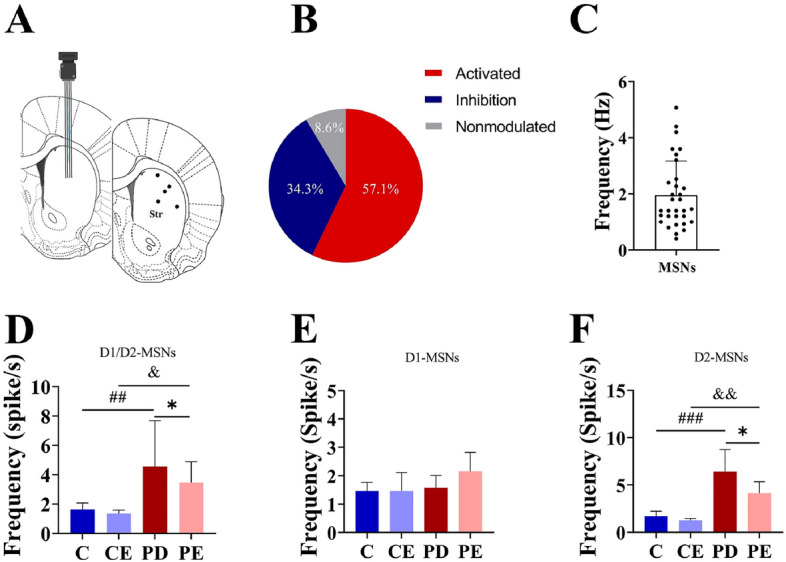
Figure 7.

MSNs frequency analysis of dorsal striatum. (A) Schematic diagram of electrode implantation sites; (B) Statistics of response to light stimulation of dorsal striatal neurons; (C) Frequency of neuronal discharges (Hz); (D) Statistical graph of overall firing frequency of D1-MSNs and D2-MSNs in the dorsal striatum (Spike/s) (n = 9); (E) Statistical graph of firing frequency of D1-MSNs in the dorsal striatum (n = 3); (F) Statistical graph of discharge frequency of dorsal striatum D2-MSNs (n = 6). ##C vs PD, P < 0.01; &CE vs PE, P < 0.05; *PD vs PE, P < 0.05; ##C vs PD, P < 0.001; &&CE vs PE, P < 0.01.
