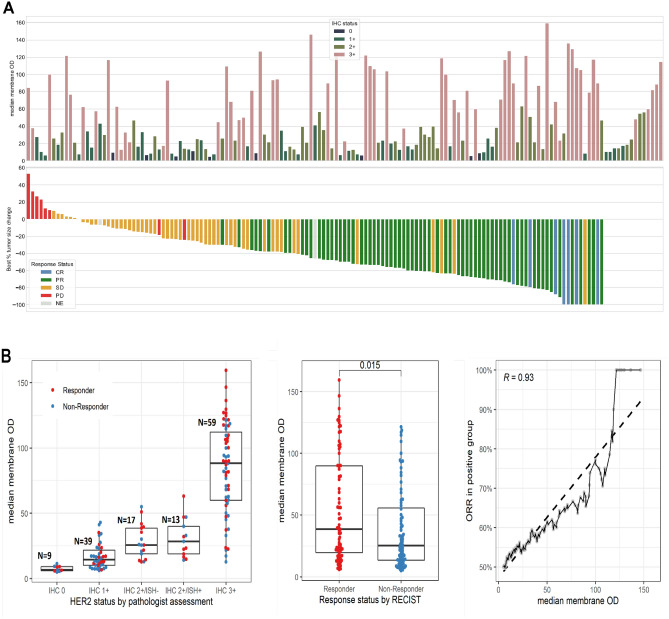
Figure 3.
(A) In the bottom part of the figure, each bar represents a single patient with breast cancer in the NCT02564900 (DS8201-A-J101 [J101]) trial, with the bars sorted according to the best percentage change in tumor size, evaluated from baseline to on- or post-therapy follow–up examination by Response Evaluation Criteria in Solid Tumors (RECIST) version 1.1. The bars are color coded according to response status: complete response (CR), partial response (PR), stable disease (SD), or progressive disease (PD). Bars for non-evaluable (NE) response cases are not shown (in the bottom figure, on the right). In the top part of the figure, the bar height represents the median membrane optical density (OD) for all tumor cells per case as computed by quantitative continuous scoring (QCS). The bar color indicates the human epidermal growth factor receptor 2 (HER2) status as assessed by a pathologist. (B) Left: HER2 expression in J101 samples as measured by median membrane OD for each category of manual immunohistochemistry HER2 status determined by pathologists according to the American Society of Clinical Oncology/College of American Pathologists guidelines. Centre: Comparison of HER2 expression as measured by median membrane OD between responders and non-responders in J101. Responders are defined as CR and PR, and non-responders as SD, PD, and NE. Statistical significance was evaluated using the Wilcoxon test. Right: Pearson correlation between mean membrane OD and objective response rate in the QCS-positive group with the dashed line depicting the corresponding regression line. The QCS-positive group at a given OD value was defined as every patient with a mean membrane OD greater than that value. IHC immunohistochemistry, ISH in situ hybridization.

