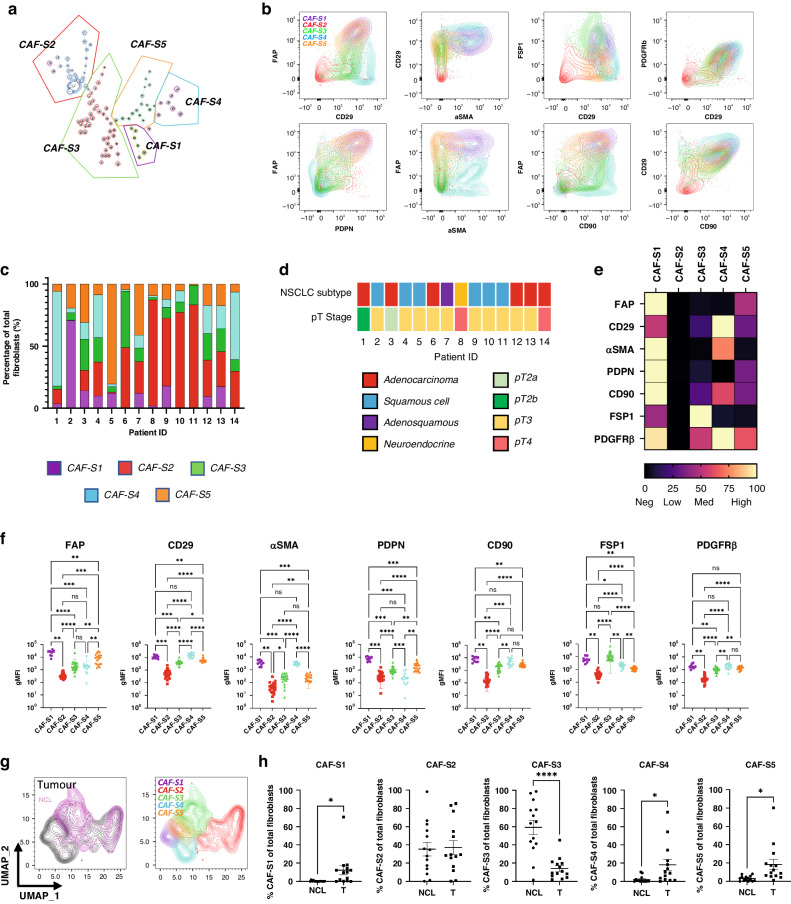
Fig. 2. CAF subsets identified in NSCLC.
a FlowSOM plot showing identification of five CAF subsets in NSCLC, CAF-S1–S5; b Expression profiles of the identified CAF subsets using the different CAF markers; c Breakdown of CAF subsets in individual NSCLC tumour samples; d NSCLC subtype and pT stage for tumour samples used in the analysis; e Heat map showing the relative levels of expression of each CAF marker, normalised within each marker, between identified subsets; f The expression levels of each marker within each subset. Each point represents geometric MFI of that marker for each sample that contained CAFs of that subset. Stats show Tukey’s multiple comparisons test results (*p ≤ 0.05, **p ≤ 0.01, ***p ≤ 0.001, ****p ≤ 0.0001); g UMAPs showing the clustering of the CAF subsets and the comparison of tumour and non-cancerous fibroblasts showing overlap within some subsets; h Comparison of the percentage of each CAF subset present in non-cancerous lung tissue (NCL) with tumour tissue. p values calculated using unpaired t-test (*p ≤ 0.05, **p ≤ 0.01, ***p ≤ 0.001, ****p ≤ 0.0001), n = 14 NCL and n = 14 tumour.

