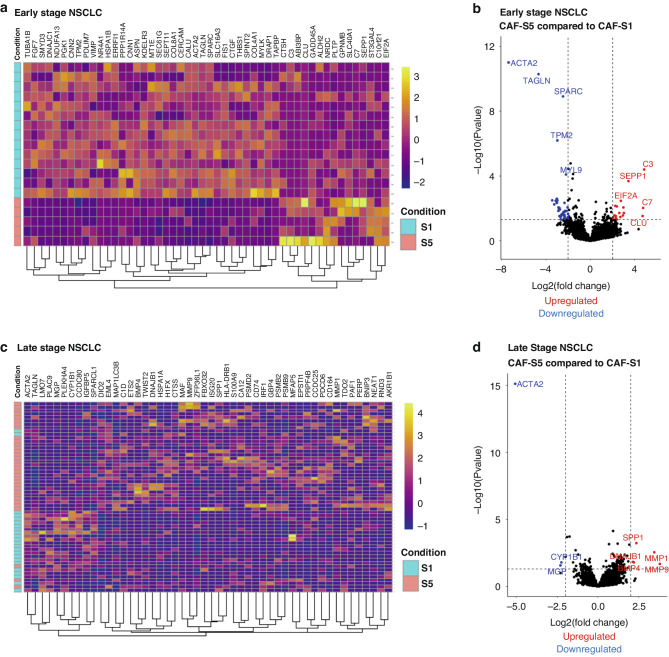
Fig. 5. Functional analysis of CAF-S1 and CAF-S5 in early and late NSCLC.
a Heat map showing top 50 differentially expressed genes in early NSCLC when comparing CAF-S1 and CAF-S5; b Volcano plot showing the most significantly up and downregulated genes when comparing CAF-S5 to CAF-S1 in early NSCLC; c Heat map showing top 50 differentially expressed genes in late NSCLC when comparing CAF-S1 and CAF-S5; d Volcano plot showing the most significantly up and downregulated genes when comparing CAF-S5 to CAF-S1 in late NSCLC. Early NSCLC data from Lambrechts et al. [22] and late NSCLC data from Wu et al. [34].

