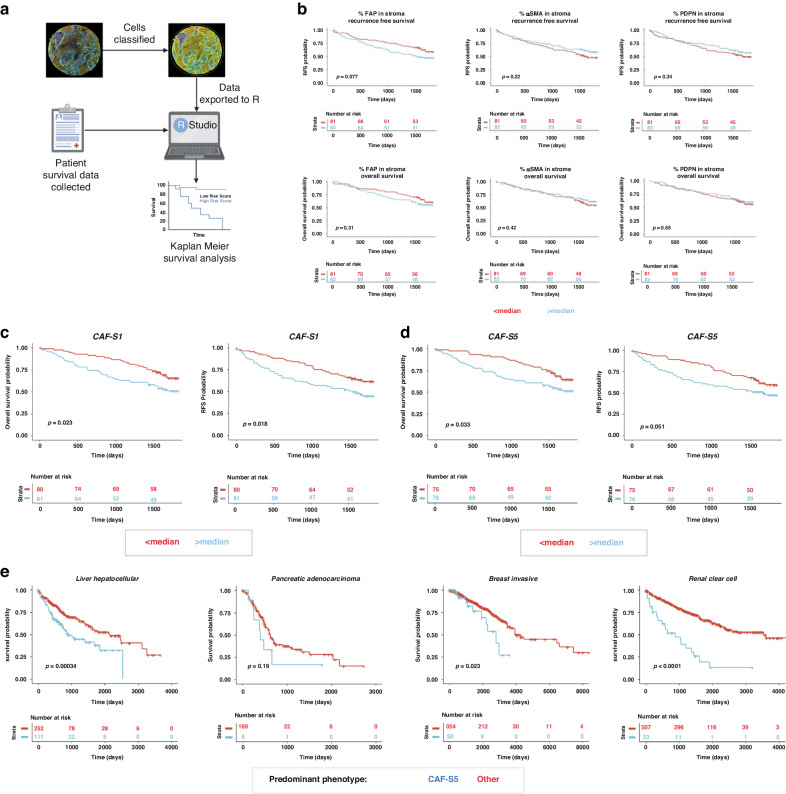
Fig. 6. Survival analysis of CAF-S1 and CAF-S5 in NSCLC and other solid organ cancers.
a Workflow of preparing data for survival analysis; b Survival looking at the percentage expression of FAP, PDPN and αSMA individually in the stroma, comparing above and below median expression. Both recurrence free survival and overall survival data shown; c Survival analysis (recurrence free and overall) of CAF-S1 when the proportion of the CAF subset present is greater or less than the median proportion expressed across all 163 patients; d Survival analysis (recurrence free and overall) of CAF-S5 when the proportion of the CAF subset present is greater or less than the median proportion expressed across all 163 patients; e Survival in other cancers from the TCGA dataset where each patient is defined as displaying a predominant phenotype by looking at FAP, PDPN and αSMA expression.

