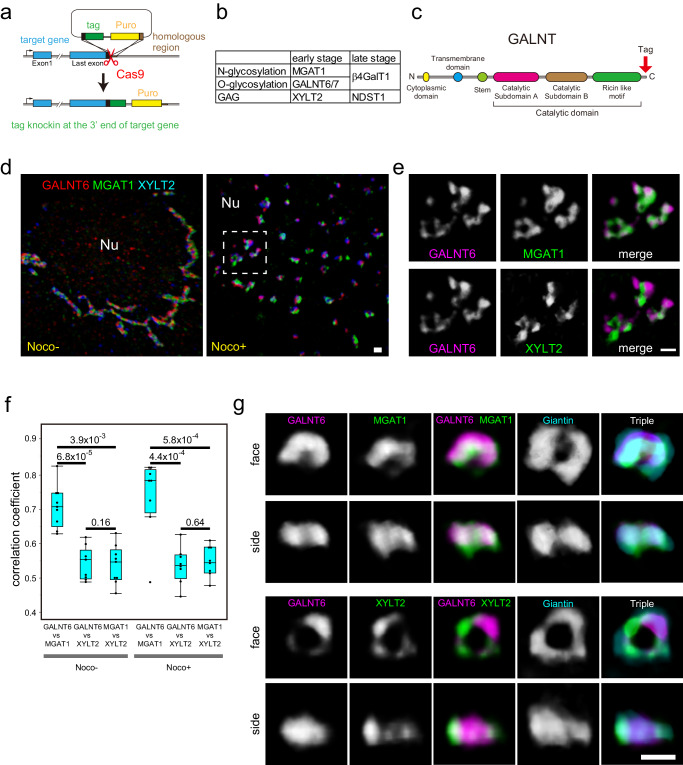
Fig. 1. Distribution of glycosylation enzymes.
a Schematic representation of knockin of tags into the exon of glycosylation enzymes. b Glycosylation enzymes used for knockin in this study. c Schematic representation of the GALNT enzyme. A tag was inserted after the catalytic domain at the C-terminus. d, e Multicolour SCLIM 3D imaging of KI cells stained with antibodies against various tags. d Distribution of GALNT6, MGAT1, and XYLT2 in a nocodazole-treated and nocodazole-untreated triple KI cell line (GALNT6-9xMyc + MGAT1-3xPA + XYLT2-3xV5) at low magnification. Left: a nocodazole untreated cell, Right: a nocodazole treated cell. e Magnified views of the dashed rectangle in the right panel of d. Upper panels: A comparison between GALNT6 and MGAT1. Lower panels: A comparison between GALNT6 and XYLT2. Nu: nucleus. Bars, 1 µm. f 3D colocalisation analysis between two enzymes in triple KI cells with or without nocodazole. Statistical significance was determined by two-tailed unpaired t test. Number of cells: 9 (nocodazole-) and 8 (nocodazole + ). P values are depicted in the graph. Boxes represent 25% and 75% quartiles, lines within the box represent the median, and whiskers represent the minimum and maximum values within 1.5x the interquartile range. g Three-colour SCLIM 3D imaging of isolated Golgi units in KI cells stained with antibodies against Myc tag, PA tag, and giantin. The upper two lines of panels show the Golgi in GALNT6-9x Myc+MGAT1-3xPA double KI cells. The lower two lines of panels show the Golgi in GALNT6-9x Myc+XYLT2-3xPA double KI cells. face: en face view, side: side view. The same Golgi unit is observed from different angles in the top two rows and the bottom two rows. Bar, 1 µm. Images are representative of at least three independent biological replicates. Imaging modalities and acquisition parameters of SCLIM are described in the materials and methods.

